
ML Interview Q Series: How would you estimate incorrect pickup pin frequency using only user location data at Uber?
📚 Browse the full ML Interview series here.
Comprehensive Explanation
One effective way to confirm how frequently users experience incorrect pickup pins is to analyze location data from trips where you have both the requested pin location and the actual user location (as captured by their smartphone). The main idea is to compare the location at which the pin was dropped (the intended pickup) with the actual on-the-ground GPS trace from the rider’s phone. By quantifying how different these two sets of coordinates are across trips, you can get a sense of how often the app shows an incorrect location that significantly deviates from where the user actually is.
A typical approach is to compute the distance between the user's reported coordinates at pickup time and the intended pickup coordinates from the app. If this distance is beyond a certain threshold (for example, 50 meters or 100 meters, depending on city density), you can label that pickup location as incorrect. Aggregating these occurrences across all rides (over a day, week, or month) will give you the percentage of trips with potentially erroneous pickup pins.
In practice, a key challenge is finding the right threshold and accounting for inaccuracies in GPS signals. In dense urban areas with tall buildings, GPS signals might drift, leading to an overestimation of how many pins are “wrong.” Incorporating techniques to mitigate GPS noise—such as smoothing or filtering the location traces—can help ensure that you do not incorrectly count legitimate pins as incorrect ones.
To illustrate how you can calculate the distance between the user’s actual location and the pinned location, one common formula is the Haversine formula, which estimates the great-circle distance on Earth’s surface using latitudes and longitudes. If lat1, long1 are the coordinates of the pinned location and lat2, long2 are the user’s true GPS coordinates, the distance d can be computed using:
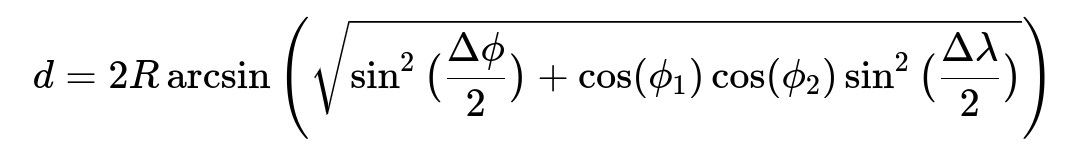
Where:
R is the approximate radius of Earth. For rough calculations, R can be taken as 6371 km or 3959 miles.
phi_1 and phi_2 are latitudes in radians for the pin and actual location respectively.
lambda_1 and lambda_2 are longitudes in radians for the pin and actual location respectively.
Delta phi is phi_2 - phi_1 in radians.
Delta lambda is lambda_2 - lambda_1 in radians.
After computing the distance d for each trip, you can count how many times it exceeds your chosen threshold that indicates a wrong pickup location. The proportion of such trips out of the total number of trips is your estimated frequency of incorrect pin placements. Mathematically, if Count(TripsWithLocationError >= threshold) is the total number of trips that exceed your selected distance threshold, and Count(AllTrips) is the total number of trips analyzed, you can define WrongLocationFrequency as:
You then express this result as a percentage to communicate how often riders face pickup pin inaccuracies.
From a practical standpoint, you would design a pipeline that runs routinely on your trip data to generate these statistics. You might also break it down by city or region to see if certain localities have more severe GPS issues than others. Another step could be cross-checking user complaints (for example, from app feedback forms) to see if they align with your computed error metrics, further validating your estimates.
When refining the threshold for what distance count is considered “wrong,” you should analyze historical data and local geography. In a sprawling suburb where riders might accept a wider radius, you could have a different threshold than in densely built urban areas, where 30 meters can mean the difference between being on the correct block or across a busy avenue.
Below is a sample Python snippet showing how you might implement the Haversine distance and count the problematic trips:
import math

def haversine_distance(lat1, lon1, lat2, lon2):
    R = 6371  # Earth radius in kilometers
    phi1 = math.radians(lat1)
    phi2 = math.radians(lat2)
    delta_phi = math.radians(lat2 - lat1)
    delta_lambda = math.radians(lon2 - lon1)

    a = (math.sin(delta_phi / 2) ** 2 +
         math.cos(phi1) * math.cos(phi2) * math.sin(delta_lambda / 2) ** 2)
    c = 2 * math.asin(math.sqrt(a))

    return R * c

# Example usage:
trips_data = [
    # (pin_lat, pin_lon, user_lat, user_lon)
    (37.7749, -122.4194, 37.7750, -122.4195),  # Minimal difference
    (34.0522, -118.2437, 34.0525, -118.2440),  # Slightly larger difference
    ...
]

threshold_km = 0.05  # For example, 50 meters
error_count = 0
for pin_lat, pin_lon, user_lat, user_lon in trips_data:
    distance_km = haversine_distance(pin_lat, pin_lon, user_lat, user_lon)
    if distance_km >= threshold_km:
        error_count += 1

wrong_location_frequency = error_count / len(trips_data)
print(f"Wrong Location Frequency: {wrong_location_frequency * 100:.2f}%")
When interpreting results, you should consider edges such as:
Sporadic GPS errors (temporary spikes).
Users who intentionally drop the pin at a more convenient location (e.g., across the street) if traffic patterns or regulations make it easier for the driver to stop there.
In regions with poor GPS coverage, small jumps in latitude and longitude might cause inflated distances.
The overall strategy—deriving a reliable ground-truth location from user phone GPS data, applying distance computations, choosing an appropriate threshold, and comparing aggregated results—offers a logical framework to estimate how often wrong pickup pins occur in real-world usage.
How would you define the threshold for incorrect pickup location?
Defining the threshold depends on both technical and practical factors. Technically, you should account for typical GPS accuracy, which might vary from 5 to 50 meters depending on device and surrounding conditions. Practically, in densely populated city centers, even a small location mismatch might cause confusion, so you might pick a tighter threshold. In suburban or rural areas, a slightly larger threshold might be acceptable. One way to tune your threshold is to:
Start with a baseline based on average GPS accuracy in a region.
Cross-reference actual complaints to see at what distances these problems genuinely affect the rider's experience.
Adjust the threshold iteratively to match user feedback patterns.
How would you handle user devices that produce unreliable GPS data?
GPS in smartphones can produce erratic data due to interference, hardware issues, or being inside buildings. To mitigate this, you could filter out obviously spurious GPS points (for example, if they show abrupt jumps of hundreds of meters in a few seconds). You can also use smoothing filters or examine multiple GPS readings over a short period to converge on a stable location estimate. Another approach is to collect location data from the driver’s phone to see if the discrepancy is consistent from both sides. However, since you may only have user data in some scenarios, you focus on advanced location filtering algorithms to reduce noise.
How do you ensure that the “wrong pin” issue is not simply user behavior?
Some users might drag the pin to a spot they believe is more convenient for pickup. If the user’s actual GPS location differs from the pin but the user is not complaining, this situation may be intentional rather than a system error. To differentiate such cases, you could look at historical user movement patterns or app usage sequences (for instance, whether the user physically dragged the pin or manually typed in an address, or if they moved around after dropping the pin). You could also incorporate user feedback forms or explicit “Was pickup location accurate?” questions within the app to refine your labeling.
How might you validate these findings if you do not have external data sources?
Without external data (like a highly accurate mapping service or ground-truth beacons), you rely on large-scale statistical patterns to identify consistent errors. By comparing typical distances between initial pin and final user location across many trips, you can establish a baseline. If that baseline drastically changes over time (e.g., a sudden increase in the average distance, or a spike in user complaint rates), it strongly suggests a systematic problem such as a bug introduced in the app’s location logic. Additionally, you can test smaller subsets of known reliable data (for instance, employees or beta testers) and compare results to the general user population, serving as a rudimentary validation check.
What further analyses or metrics could you explore?
You could break down wrong pin occurrences by:
Time of day (GPS might be less accurate during certain periods if the device is indoors).
User device type or operating system version (certain devices may have more advanced hardware).
Weather conditions or local infrastructure.
Urban vs. rural settings to see if the errors correlate with city density.
You might also incorporate user feedback beyond merely user location traces—like in-app complaints, help-center chats, or star ratings—to correlate quantitative GPS-based estimates with qualitative real-world experiences. By continuously tracking these trends, you can identify whether you have improved or worsened the location accuracy with each subsequent app release.
Overall, the key process is:
Collect user location data throughout the trip, including final pickup.
Compute the distance between the pinned location and actual user coordinates at pickup.
Use a well-defined threshold to classify when the pin was “wrong.”
Aggregate these errors over all trips to form a ratio or percentage.
Drill down into different segments for deeper insights.
Below are additional follow-up questions
How would you detect subtle location drifts that occur intermittently, and how might you account for them?
Even if your main approach is to compare the rider’s pinned location with the final GPS reading at pickup, real-world data often has small but frequent “drifts.” These can be caused by temporarily losing GPS signal (for instance, driving under a bridge or through a tunnel), or due to the phone switching between cell-tower triangulation and satellite-based GPS. If you only examine one “snapshot” of location data, you might misclassify trips as having incorrect pins.
One way to detect and account for such drifts is to collect multiple GPS readings over a short window near the pickup time, then smooth them. You can:
Compare consecutive GPS points for abrupt changes. If these abrupt changes exceed a certain velocity threshold that is not physically plausible (e.g., jumping half a kilometer in a second), treat them as potential noise.
Use smoothing filters (like a simple moving average or a Kalman Filter) on the location data. Kalman Filters, for instance, model both the measurement noise and the system’s dynamic (e.g., user speed or direction).
A potential pitfall is over-smoothing. You risk blurring important changes if the rider is actually moving toward a new spot. By conducting tests on sample data where ground truth is relatively known (perhaps from test phones in stable environments), you can calibrate how much smoothing is beneficial before real signals become obscured.
What if the user is in transit or walking toward the pickup area while the ride is being arranged?
Many riders request an Uber before they have settled in one place—say, they are leaving a building or walking out of a mall parking lot. This makes the concept of a single “true” location ambiguous. If your approach is to compare the final pinned location with the “true” location at pickup time, you may falsely label many rides as incorrect simply because the user moved.
To handle such mobile users, you could:
Track the user’s trajectory for a few minutes after they request the ride, noting whether their pinned location remains consistent with the path they take.
Check how often a user’s location crosses a threshold distance from the pin more than once (indicating the user is traveling). You may need to allow a more generous margin for “correctness” if the user is known to be in motion.
Optionally incorporate a user flow in the UI that explicitly asks them to confirm their final spot if the system detects significant user movement relative to the pin.
A subtle real-world issue is that some users might move on purpose (e.g., they see their driver approaching a street corner, so they walk to meet the driver). In such cases, the “wrong” pin might not be an app error—it might be the user’s last known stationary location. Differentiating these scenarios often requires analyzing movement patterns during the pickup window.
What strategies can you adopt to incorporate driver location data (if available) to refine pickup correctness?
If the driver’s smartphone also provides GPS data, you can compare how closely the driver’s and user’s locations converge at pickup. In many scenarios, the driver’s location might be more accurate (due to better hardware or a clearer line of sight). You can:
Correlate times where the driver is marking “arrived” with the user’s phone location to gauge if they are both in roughly the same area.
Look at how long a driver waits at a location before the user arrives. Long wait times could indicate that the pin was incorrect.
Pitfalls arise when you assume the driver’s phone is always correct. Driver devices also suffer from GPS errors. Additionally, the driver’s route might place them on the wrong side of a one-way street, making them physically close in linear distance but inaccessible in practice.
You can also do a multi-sensor comparison:
If both devices show widely differing coordinates, you can suspect a mapping or device error.
If both devices show near-identical drift in an area known for poor GPS reception, you can rule out an actual “wrong pin” and classify it as an environmental limitation.
How do you distinguish between systematic map errors and user-based GPS inaccuracies?
Sometimes the underlying map data or geocoding system is faulty—for example, an entire building’s address is marked in the wrong place. In these scenarios, both the user’s phone and the driver’s phone might appear correct in raw GPS terms, but the pin is placed incorrectly because the address or business location is misrepresented on the map.
To isolate map errors:
Look for clusters of user complaints or repeated large distances in the exact same area. If you see repeated misplacements for multiple riders requesting from the same building or street corner, this strongly hints at a map data issue.
Cross-reference historical ride data: a location that regularly produces an unusual discrepancy likely indicates a consistent geocoding or map-tile error.
Implement a feedback loop where drivers can suggest correct pickup spots for known trouble areas, then see if that resolves the mismatch for subsequent users.
A key pitfall is that map issues can be region-specific. You may fail to detect them if you only examine aggregated data on a very large scale. Investigating suspicious hotspots or anomalies in your distance metrics helps discover these localized but systematic problems.
How would you handle and correct location errors in real time to improve the user’s experience?
While post-ride analysis helps quantify pickup pin errors, it does not fix them immediately for a rider who is currently trying to meet their driver. Real-time solutions could include:
Prompting the user to confirm their location if the system detects a major discrepancy between the app’s pin and recent GPS readings. A quick UI popup could say, “We detected your phone is in a different spot than your pin. Update your pickup location?”
Providing continuous location verification on the map and automatically nudging the user’s pin if a strong discrepancy emerges. This might require user consent or an explicit setting, as some riders intentionally set a pin different from their exact GPS location.
Using predictive modeling: if the user’s GPS data has historically been inaccurate (e.g., large error variances) at that time of day or in that neighborhood, adjust the map’s “confidence” in the pin and prompt for verification more aggressively.
A subtle challenge is balancing user autonomy with automated corrections. Constant pop-ups might annoy users who have intentionally chosen a location. Also, due to network delays, real-time adjustments might lag behind the user’s actual movement, leading to confusion if the system re-centers the pin after the user has already confirmed it.
How do you ensure data quality at scale when ingesting millions of GPS points across different markets?
Ensuring data reliability becomes harder at global scale. Different markets can have unique phone models, varied urban architectures, and local GPS disruptions. You can:
Implement data pipelines that flag outliers and missing fields early. For instance, if your system sees coordinates (0,0) or lat/lon outside plausible bounds, it can discard or quarantine those data points.
Maintain a metadata layer with each GPS reading, storing details like the device OS, manufacturer, or whether the user was connected via Wi-Fi or cellular data. This helps you diagnose suspicious location patterns specific to certain device types or network conditions.
Use heuristics to handle anomalies—for example, if a user location jumps from one city to another in under a minute, you can disregard that data as corrupted.
Pitfalls include ignoring local differences or placing too much trust in uniform thresholds. A 100-meter threshold may be too high for a crowded city like Manhattan but might be acceptable for a suburban area. Also, as data volume grows, computational cost of sophisticated smoothing or calibration can become an issue, requiring efficient algorithms or sampling methods.
Below is an example formula for applying an exponential moving average (EMA) to the user’s GPS locations in the final minute before pickup. Let x_t be the smoothed location at time t, and z_t be the raw GPS reading (latitude and longitude) at time t:
Here:
alpha in [0,1] is the smoothing factor determining how much weight you give to past (already smoothed) data versus the most recent reading.
x_{t-1} is your previous smoothed coordinate, while z_t is the current observed coordinate.
As alpha approaches 1, you give more weight to past data, leading to slower reaction to sudden changes.
As alpha approaches 0, you rely more heavily on the most recent location, reducing smoothing benefits.
A final consideration is that you may need separate alpha values for latitude and longitude (especially if you suspect different degrees of noise), but typically, a single alpha for both coordinates is sufficient.