
ML Interview Q Series: How would you analyze whether Netflix’s subscription cost is genuinely the primary factor influencing a consumer’s decision?

📚 Browse the full ML Interview series here.
Comprehensive Explanation
Determining whether subscription price is the dominant factor that drives a consumer’s decision to subscribe to (or leave) Netflix typically involves both qualitative and quantitative methods. Below are the core ideas and strategies you might apply in such an investigation.
Qualitative Exploration
Interviews and Surveys Begin with open-ended interviews or carefully crafted surveys. By directly asking users what aspects matter most—price, content library, user experience, social recommendations, or other factors—you can collect self-reported data on whether price is indeed perceived as the top motivator or barrier.
Focus Groups Conducting focus groups can offer deeper insight into consumer preferences and behaviors. In a moderated group setting, participants often elaborate on subtleties, like how they weigh streaming service price versus the quality of content or the number of concurrent device streams.
Quantitative Analysis of User Behavior
User Engagement Metrics Examine watch-time, session frequency, and time spent per session. If users with lower-cost plans show similar or higher engagement levels compared to those on higher-cost plans, it may point to factors beyond price—such as content variety or convenience—being equally vital.
Churn Analysis Look at churn events (when users cancel the service). You can track how these cancellations correlate with price changes or user segments more sensitive to pricing. A spike in churn immediately following a price increase might indicate that cost is a leading factor, whereas churn driven by other patterns (content dissatisfaction or competitor offers) might suggest otherwise.
Causal Inference Approaches
A/B Testing One direct way to assess whether price is a key driver is through price-based A/B tests (though this should be done carefully for ethical and brand perception reasons). For different user segments, you might set different subscription prices and observe if a lower or higher price significantly alters key metrics such as subscription conversion, upgrades/downgrades, and churn rates.
If you want to conduct a statistical test for differences (e.g., difference in average subscription rates between a control group and a test group with a different price), you may compute the t-statistic:

Here, x_1 is the mean outcome (e.g., subscription conversion rate) for one group, x_2 for the other group, sigma_1^2 and sigma_2^2 are the variances of each group, and n_1, n_2 are the group sizes. A sufficiently large t-value (in absolute terms) indicates a statistically significant difference in those outcome metrics, potentially isolating the effect of price.
Difference-in-Differences Another way to gauge the impact of price changes is to employ a difference-in-differences approach if you have a “before vs. after” scenario plus a comparable control group that did not experience a price change. This can help reduce confounding factors that might also influence user behavior.
Modeling Subscription Probability
Logistic Regression You can model user decisions (subscribe or not) with logistic regression, incorporating price as one of the explanatory variables. Controlling for other covariates (like content satisfaction, watch history, competitor subscriptions, and demographic variables) will help isolate the marginal effect of price on the probability of subscription.
A simplified logistic regression model for subscription probability p can be represented by:
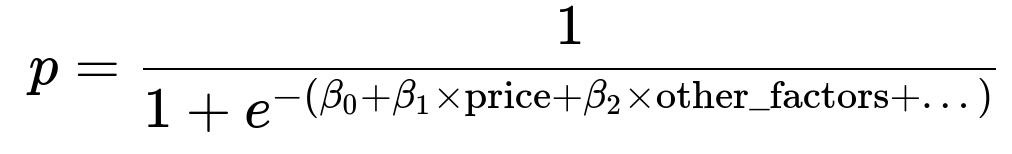
In this formulation, beta_1 captures the effect of price on the log-odds of subscribing. If beta_1 is large in magnitude and statistically significant, it signals that price has a strong influence.
Evaluating Price Elasticity
Price elasticity of demand is another fundamental tool to assess how sensitive customers are to subscription price changes. It measures how the quantity demanded (like the number of new subscribers or retention rate) varies with price changes.

Where E is the price elasticity, Q is the quantity demanded, and P is the price. A higher absolute value of E indicates that consumers are highly sensitive to price changes. If your analysis shows that a small increase in price causes a sharp drop in subscriptions (elastic demand), it’s evidence that price is indeed a deciding factor.
Practical Implementation Example
Below is a minimal Python snippet showing how you might perform a logistic regression in practice, focusing on price as one potential predictor among others:
import pandas as pd
from sklearn.linear_model import LogisticRegression
from sklearn.model_selection import train_test_split

# Example dataset where "Subscribed" is a binary column,
# "Price" is the monthly subscription price seen by the user,
# and "ContentScore" represents some measure of content quality or user rating.
data = pd.DataFrame({
    'Subscribed': [1, 0, 1, 1, 0, 1, 0, ...],
    'Price': [9.99, 15.99, 9.99, 12.99, 15.99, 9.99, 15.99, ...],
    'ContentScore': [8, 7, 9, 7, 6, 8, 7, ...]
})

X = data[['Price', 'ContentScore']]
y = data['Subscribed']

X_train, X_test, y_train, y_test = train_test_split(X, y, test_size=0.2, random_state=42)

model = LogisticRegression()
model.fit(X_train, y_train)

# Checking coefficients to see how price influences subscription
coefficients = model.coef_
intercept = model.intercept_
print("Coefficients: ", coefficients)
print("Intercept: ", intercept)

accuracy = model.score(X_test, y_test)
print("Accuracy on test data:", accuracy)
Examining the coefficient for the “Price” feature reveals its impact on the log-odds of subscribing. A strongly negative coefficient, assuming statistical significance, signifies that as price increases, the probability of subscription falls substantially.
Possible Follow-up Questions
How do you control for confounding variables when trying to isolate the effect of price?
One approach is to include additional explanatory variables in your model, such as content satisfaction, streaming quality, brand perception, or competitor options. By doing so, you attempt to ensure that any observed correlation between price and subscription outcome is not simply due to other factors correlated with price (e.g., premium plans that provide multiple screens might cost more but also deliver additional perks, which confound the price effect).
Another method is randomization in A/B tests. By randomly assigning users to different price points, you neutralize the influence of confounders on average. In observational studies, you can use matched sampling or propensity score matching, which helps ensure that two groups (e.g., one that faced a price increase and one that did not) are comparable in terms of relevant features.
What if user segments differ in price sensitivity?
Real-world user bases are rarely homogenous. Some segments (e.g., students, budget-conscious consumers, or heavy content watchers) might be more sensitive to even small price shifts. Conversely, consumers with higher disposable incomes or those highly invested in certain exclusive shows might be less sensitive to price hikes.
A viable approach is to segment users based on relevant attributes and run separate analyses or A/B tests within each segment. Price elasticity might differ across segments, and the resulting strategies should reflect these variations (e.g., special student discounts, premium tiers for more affluent customers, etc.).
How would you separate the effect of competitor actions from Netflix’s price change impact?
Competitor moves—like launching high-profile shows, offering promotional pricing, or improving user experience—can coincide with your analysis window, confounding your estimate of how price affects consumer decisions. To address this:
Track competitor influences explicitly by gathering data on competitor prices, marketing campaigns, or major content releases.
Incorporate competitor measures as explanatory variables in your model (e.g., a time-series variable indicating competitor’s promotional events).
Use difference-in-differences or synthetic control methods where you compare Netflix subscriber behavior to a similar streaming service that did not change its pricing structure at the same time.
By structuring your experiments or observational models to account for these external events, you can better isolate the specific effect of Netflix’s price changes.
How do you interpret a result showing no significant correlation between subscription price and user behavior?
If results indicate that changes in Netflix’s subscription price do not significantly alter user subscription or churn rates, it may imply one or more of the following:
Consumers may value exclusive shows or a robust content library more than incremental changes in monthly cost.
A certain threshold might exist; as long as the price remains below that threshold, most users will not be swayed by moderate increases.
Brand loyalty or inertia (habit of continuing the service) may overshadow small price fluctuations.
In such a scenario, further investigation could reveal precisely which non-price factors (e.g., brand recognition, content variety, ease of use) hold the greatest sway, and how you might optimize them for user retention.
Below are additional follow-up questions
How might external macroeconomic factors confound your analysis of price sensitivity?
One complication arises when broader economic conditions change consumer behavior, sometimes overshadowing or amplifying the effect of a subscription price. For instance, if an economic downturn reduces disposable income across the board, you might notice a decline in Netflix subscriptions. However, that might not be entirely due to price changes but rather a result of fewer people being willing to spend on non-essentials. Conversely, during periods of strong economic growth, people might be more tolerant of subscription price increases. This introduces challenges:
Separating global and local shocks: If you see a spike in churn, you need to analyze whether it's triggered by an external factor (e.g., sudden unemployment surges) rather than just Netflix’s price hike.
Establishing robust baselines: Using historical subscription data from similar economic phases can help establish a more relevant baseline for comparison.
Controlling for household income changes: Segmenting data by geographic region or by correlated economic indicators can help isolate the effect of macro-level income shifts.
It’s often best to combine internal analytics with external economic indicators (e.g., consumer confidence indices, unemployment rates). By regressing churn or subscription rates on both price and relevant external indicators, you can better distinguish how much influence your pricing exerts over consumer decisions.
How do you factor in intangible elements like brand loyalty or brand perception when assessing the impact of price?
Brand loyalty can result in subscribers who remain for reasons beyond objective considerations like content library or monthly costs. This can confound your attempts to isolate price impact:
Brand loyalty metrics: Surveys or sentiment-analysis approaches can quantify how strongly customers feel connected to the service. This might be measured with a Brand Strength Index, Net Promoter Score, or other brand equity metrics.
Time-based loyalty: Users who have been subscribed for multiple years might be less price sensitive due to familiarity with the platform. Segmenting data by tenure can reveal whether long-time subscribers are less likely to churn, even if there’s a price hike.
Disentangling brand effect: In a logistic regression or other predictive models, you might include a loyalty score or net promoter variable alongside price. This can show how an increase in price affects subscribers who are otherwise highly loyal vs. those who are neutral toward the brand.
Keep in mind that brand perception often evolves over time, especially after highly publicized price hikes or new feature releases. Continual monitoring of brand metrics is critical for recognizing shifts that might suddenly make price a bigger—or smaller—factor.
What is the role of content exclusivity and original programming in overshadowing or reinforcing the price factor?
Exclusive shows or original programming can have a powerful pull. In some scenarios, a relatively higher subscription cost becomes less critical if a significant portion of the audience is primarily drawn to exclusive hits (e.g., a highly anticipated Netflix-produced series). Yet, this dynamic can operate in two directions:
Content overshadowing price: If a new blockbuster series launches, price can become secondary for viewers eager to access that content immediately. Even at a higher subscription rate, subscribers might be willing to pay.
Consistency issue: A single hit may only temporarily reduce price sensitivity. If original content quality fluctuates, then price becomes more important during content lulls.
Quantifying exclusive-driven retention: You could analyze patterns of user engagement, churn, and sign-ups correlated with the release schedules of major original shows. If data reveals spikes in sign-ups that coincide with new seasons, and churn occurs soon after those seasons end, you know content is dominating the price decision.
A practical approach is to combine content popularity metrics (e.g., viewership data, social media buzz) with subscription data. By cross-referencing user segments that watch exclusive content with those that do not, you see how those groups differ in price sensitivity.
How can you address the risk of survey or self-report biases when gathering data about price importance?
Surveys, focus groups, and interviews often suffer from social desirability bias, recall bias, or other forms of inaccurate self-reporting. Customers might insist that price is or isn’t a factor, but their actual behavior can deviate from these statements. Potential solutions include:
Behavioral validation: Pair survey data with actual usage and subscription status. If a user claims price is unimportant but churns immediately after a price raise, that discrepancy provides insight into how reliable their self-reported data might be.
Indirect questioning: Instead of directly asking, “Is the Netflix price too high for you?” you can deploy choice-based conjoint analysis or ask them to rank multiple hypothetical scenarios that vary in price and content. This approach may reveal nuanced preferences that direct questions fail to capture.
Controlled experiments: Where feasible, an experimental design that manipulates price for random subgroups provides direct behavioral evidence, circumventing reliance on self-reports.
Acknowledging and adjusting for these biases ensures you avoid concluding that consumers are primarily concerned with or indifferent to price solely based on their direct statements.
If data availability is limited, how do you approach partial or incomplete data when assessing if price is the key factor?
Data limitations can arise when you lack historical records, face restricted access to competitor information, or have incomplete user profiles. Nevertheless, you can still glean insights through several strategies:
Incremental modeling: Build simplified models using whatever data is available (e.g., subscription events and partial demographic indicators). Even a partial logistic regression can provide clues if price remains a strong predictor of churn or subscription.
Feature engineering: If detailed demographic or usage data is missing, proxy variables might be used (e.g., approximate household income by correlating with ZIP code median income). While not perfect, these proxies can still reduce omitted variable bias in the analysis.
External benchmarks: Industry research or third-party market studies might fill in gaps. For example, if your internal data on competitor prices is incomplete, you can integrate reliable market surveys.
Simulation and stress testing: Conduct scenario analyses by simulating different price points and assumptions about unknown factors. Observing how outcomes shift under different assumptions can reveal whether price is robustly influential or overshadowed by missing data.
Regardless, it’s essential to be transparent about data gaps and the uncertainty in any conclusions drawn. When possible, plan iterative data collection strategies (e.g., user panels, new instrumentation) to refine and verify initial hypotheses about price significance.