
ML Interview Q Series: Implement K-Means clustering from scratch in Python and return cluster labels for each data point.

📚 Browse the full ML Interview series here.
Comprehensive Explanation
K-Means clustering is an unsupervised learning technique that aims to partition data points into a specified number of groups (clusters). Each cluster is associated with a centroid, which represents the average location of the points in that cluster. The algorithm iterates between assigning each data point to the cluster with the closest centroid and recalculating the centroid positions until convergence (or until it hits a maximum number of iterations).
A commonly used objective is to minimize the sum of the squared Euclidean distances between each data point and its assigned cluster centroid. This objective is often referred to as the Sum of Squared Errors (SSE).
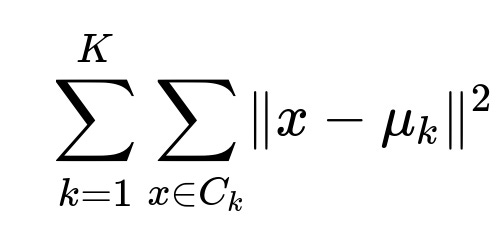
Where x is a data point in cluster k, C_{k} is the set of all points assigned to cluster k, and \mu_{k} is the centroid (mean) of cluster k. This expression captures the total within-cluster variance we want to reduce.
Once each point is assigned to a cluster, the new centroid for that cluster is computed as the arithmetic mean of all the data points belonging to that cluster.

The K-Means algorithm generally follows these conceptual steps:
Initialize K centroids, typically by randomly selecting K distinct points from the dataset or using more sophisticated initialization methods such as k-means++.
Assign each data point to the closest centroid.
Recompute each centroid by taking the mean of the points assigned to that cluster.
Repeat the assignment and centroid update steps until there are no changes (or until a preset maximum number of iterations has been reached).
Practical Implementation in Python
Below is a simplified Python implementation of K-Means clustering from scratch. The code avoids optimized matrix operations for clarity, but in practice, you would use vectorized methods in libraries like NumPy to make it more efficient.
import random
import math

def euclidean_distance(a, b):
    return math.sqrt(sum((a_i - b_i)**2 for a_i, b_i in zip(a, b)))

def compute_centroid(points):
    # Calculate the mean for each dimension
    num_points = len(points)
    if num_points == 0:
        return None  # Handle empty cluster edge case
    # Transpose the list of points and find the average of each dimension
    dimensions = len(points[0])
    new_centroid = []
    for dim in range(dimensions):
        coord_sum = sum(point[dim] for point in points)
        new_centroid.append(coord_sum / num_points)
    return new_centroid

def k_means(data_points, k, max_iterations=100):
    # Randomly select k distinct points from the dataset as initial centroids
    centroids = random.sample(data_points, k)

    for _ in range(max_iterations):
        # Create empty clusters
        clusters = [[] for _ in range(k)]

        # Assign each data point to the nearest centroid
        for point in data_points:
            distances = [euclidean_distance(point, centroid) for centroid in centroids]
            cluster_index = distances.index(min(distances))
            clusters[cluster_index].append(point)

        # Store old centroids to check for convergence
        old_centroids = centroids

        # Recompute the centroid of each cluster
        centroids = [compute_centroid(cluster) for cluster in clusters]

        # Replace any None centroids with a random data point (edge case if cluster is empty)
        for i in range(k):
            if centroids[i] is None:
                centroids[i] = random.choice(data_points)

        # If no centroid moved, we consider it converged
        converged = True
        for i in range(k):
            if euclidean_distance(old_centroids[i], centroids[i]) != 0:
                converged = False
                break

        if converged:
            break

    # Construct the final assignment for each point
    cluster_assignments = []
    for point in data_points:
        distances = [euclidean_distance(point, centroid) for centroid in centroids]
        cluster_index = distances.index(min(distances))
        cluster_assignments.append(cluster_index)

    return cluster_assignments

# Example usage:
points = [
    [1.0, 2.0],
    [1.5, 1.8],
    [5.0, 8.0],
    [8.0, 8.0],
    [1.0, 0.6],
    [9.0, 11.0]
]

assignments = k_means(points, k=2)
print(assignments)
This function returns a list (assignments) that tells you to which cluster each point belongs. For instance, if the first data point is in cluster 0, the second in cluster 0, the third in cluster 1, etc., you might see output like [0, 0, 1, 1, 0, 1].
How to Handle the Complexity and Scalability
When K-Means is applied to high-dimensional or very large datasets, computational complexity can grow. Methods such as mini-batch K-Means can be used to speed up the process by updating centroids with a sample of data in each iteration. Additionally, initialization strategies like k-means++ can greatly improve convergence time and stability by choosing initial centroids more intelligently than random selection.
Potential Follow-up Questions
How can we choose an optimal number of clusters K in practice?
Elbow Method is one common approach, where you run K-Means for different K values and observe the point at which the SSE (or within-cluster sum of squares) drops off more slowly. There is also the Silhouette Score, which measures how similar points are within a cluster compared to points in other clusters. In practice, domain knowledge might guide you toward a reasonable K, especially when you have intuition about how many groups your data should form.
What happens if one of the clusters ends up empty?
It can occur if the centroid of a cluster is too far from most points, causing all points to cluster elsewhere. The code example checks for an empty cluster and re-initializes the centroid by choosing a random data point to handle that edge case. If not handled, it might lead to division by zero errors or a centroid that is None during an update step.
How does the choice of distance metric impact K-Means?
K-Means typically uses Euclidean distance. This works well for many continuous, spherical-type data distributions. However, if the dataset has features that are of very different scales or forms, scaling or a different distance metric might be necessary. Some variations of K-Means use other metrics like Manhattan distance, but the method for recomputing centroids might need adjustment in those cases (e.g., medoids rather than means).
Can K-Means cluster non-spherical or heavily imbalanced data well?
K-Means presumes clusters are somewhat spherical in shape and have roughly similar densities. If your data does not match these assumptions (for example, if you have elliptical clusters, clusters of drastically differing densities, or complicated manifold-shaped data), it may not perform well. In such cases, alternative clustering methods like DBSCAN or Gaussian Mixture Models could be more suitable.
Does random initialization impact the final result?
K-Means can converge to a local minimum, which might differ based on the initial placements of centroids. Random initialization can lead to suboptimal clustering. The k-means++ algorithm improves the initial centroid selection process by spreading out the initial cluster centers, often producing better solutions more consistently.
How do we detect convergence in K-Means?
Convergence is typically declared when the centroids stop moving, or when the changes in centroid positions are smaller than a threshold. Alternatively, a maximum iteration limit can also be set. Because of the iterative nature, K-Means converges relatively quickly, although it might land in a local minimum rather than the global optimum.
What practical issues can arise when the dataset is very large?
Memory constraints might cause problems if you attempt to load all data into memory at once. K-Means also has a time complexity that can be costly for very large datasets. Incremental or streaming versions of K-Means (e.g., mini-batch K-Means) can help, where you process small batches of data at a time to update your centroids. This approach reduces memory usage and can still achieve good clustering performance.
Below are additional follow-up questions
How does K-Means behave in the presence of outliers or extreme values, and how can we address such scenarios?
An outlier, being far from most other points, can disproportionately influence the cluster centroid. Since K-Means minimizes the sum of squared distances, a single point that is very far away will increase the centroid’s movement in that direction. This can lead to poor clustering if outliers skew the centroid position.
One common strategy is to preprocess the data to reduce the effect of outliers:
Consider outlier detection and removal if you have domain knowledge indicating they are invalid data points.
Apply robust scaling methods (for example, using the median instead of the mean for normalization).
Use alternative clustering methods (such as K-Medians or K-Medoids) that are less sensitive to extreme values because the centroid (or medoid) is chosen to minimize absolute deviations, not squared deviations.
A subtlety to watch out for is that sometimes “outliers” are actually legitimate data points representing a unique subset of data. Removing them blindly might lose potentially important information. In such situations, it may be more appropriate to segment them into a dedicated cluster if that aligns with the problem context.
When is it important to scale or normalize features before applying K-Means, and what might happen if we skip this step?
K-Means relies on Euclidean distance, which is sensitive to the magnitude of features. If one feature has a much larger numerical range than others, it will dominate the distance metric, making the algorithm effectively cluster along that feature’s scale. This can produce misrepresentative clusters if all features should be considered equally.
Normalizing data to a similar scale is crucial when:
Features have different measurement units or widely differing numeric ranges (e.g., “annual income” in thousands versus “age” in years).
The domain knowledge suggests no single feature should overshadow the distance calculation.
If you skip scaling:
The algorithm may produce clusters heavily biased by the feature with the largest scale.
Subtle signals in other features might be overlooked.
Interpreting the final clusters might be confusing because you can’t be certain whether the clustering primarily reflects one dimension.
A pitfall is over-normalizing if certain dimensions genuinely carry more importance or if your domain knowledge suggests a weighting among features. Blindly scaling can lose that nuance. Hence, always consider the context to determine an appropriate normalization or weighting scheme.
How does missing data affect K-Means, and what strategies can we use to handle missing values?
K-Means (in its vanilla form) does not inherently handle missing data. The Euclidean distance calculation between a point with a missing value and a centroid is undefined if part of the data is not available. A few potential strategies include:
Dropping incomplete records, which can cause loss of data (risky when missingness is significant).
Imputing missing values before clustering. This can be done using mean, median, or more advanced methods like k-NN imputation. However, imputation might introduce bias if the missing data is not missing at random.
Using clustering methods specifically designed to handle missing data. Some variants of K-Means can skip missing components or weight them differently.
A subtlety here is that the method of imputation itself can influence the resulting clusters. Simple mean/median imputation may shrink your data toward the center and reduce variance artificially, affecting cluster shapes. More sophisticated imputation might preserve more realistic data distributions. Also, if values are missing for non-random reasons, standard imputation may produce misleading clusters.
In what ways can we parallelize or distribute K-Means for extremely large datasets, and what are the trade-offs?
K-Means can be parallelized because the most computationally heavy part (assigning points to the nearest centroid) can be done independently for subsets of data.
Implementation approaches include:
MapReduce or Spark: Distribute data across multiple worker nodes. Each worker computes partial sums and counts for assigned clusters locally. The master node aggregates the partial results to update centroids.
Mini-batch K-Means: Processes small batches of data at a time, updating centroids incrementally. This reduces memory usage and accelerates each iteration, at the risk of slightly lower clustering accuracy if the mini-batches are not representative.
A key trade-off is that distributed or mini-batch methods might produce slightly less precise centroids than the full, iterative approach on a single machine. This discrepancy often remains small enough that the performance benefit justifies it. Also, in a distributed environment, communication overhead between nodes can become non-trivial. Balancing this overhead with the need for local computations is crucial for performance gains.
Can we interpret K-Means centroids in a domain-specific context, and what challenges might arise in doing so?
K-Means centroids represent the arithmetic mean of points within each cluster. In a domain context (like customer segmentation or image segmentation):
Each dimension of the centroid can be interpreted as the “average” feature for that cluster. For example, if your features are “annual income” and “age,” the centroid might be something like an income of 60k with an age of 35.
This interpretation can help describe the typical characteristics of a segment or group.
Challenges include:
High Dimensionality: Interpreting centroids in dozens or hundreds of dimensions becomes unintuitive.
Heterogeneous Features: If some features are numeric while others are ordinal or categorical, the meaning of a centroid gets blurred. A centroid might end up with an “impossible” combination of feature values (e.g., 2.4 children or color value that’s not actual in your categorical domain).
Skewed Data: If one feature is highly skewed, the centroid might not reflect a typical real data point. The center might lie in a region with little actual data presence.
Providing domain context, dimensionality reduction, or alternative cluster descriptors (like medoids) can sometimes provide more interpretable insights.
Under what circumstances would we choose a different clustering algorithm over K-Means?
Although K-Means is popular, it has specific assumptions that might not hold in all scenarios. You might choose alternative clustering algorithms when:
You have non-spherical clusters or a distribution that K-Means can’t handle well (like curved manifolds). DBSCAN or Mean-Shift might be more suitable in such cases.
You want to account for probabilistic cluster assignments rather than hard memberships. Gaussian Mixture Models (GMM) offer a “soft” assignment, which might be more realistic when clusters overlap significantly.
You deal with categorical or mixed data. K-Means relies on means of continuous values; for categorical data, algorithms like K-Modes or K-Prototypes might be better.
You have a lot of noise and outliers that can strongly shift centroids. DBSCAN, which can mark outliers and discover an arbitrary number of clusters, might be more robust.
A subtle pitfall is using K-Means simply because it’s well-known, without checking the data distribution and domain context. This can lead to misleading clusters or poor performance. Evaluating cluster shapes, the presence of outliers, and the nature of features is crucial before deciding on K-Means or an alternative.
Is there a way to use K-Means iteratively to refine results, and what pitfalls should we be aware of?
Yes, a common approach is to run K-Means multiple times with different initial centroid seeds and choose the run that gives the lowest within-cluster sum of squares. This helps mitigate the possibility of poor initialization leading to suboptimal solutions.
However, potential pitfalls include:
Overfitting the data if you repeatedly refine clusters while ignoring generalizability.
Computational overhead when you run K-Means many times, especially for large datasets.
Local minima: Even with multiple restarts, it’s not guaranteed you’ll find a global optimum. You might only reduce the chance of settling into a bad local optimum.
Evaluating the stability of cluster assignments across multiple runs can also be helpful. If cluster labels are highly inconsistent between runs, that might indicate your data doesn’t have distinct clusters or that you need to revisit your feature engineering or choice of distance metric.
How can K-Means be extended or modified to handle data streams in real time?
Standard K-Means is batch-based, requiring the entire dataset upfront. To handle streaming data:
Online K-Means (or incremental K-Means) updates centroids as new data points arrive. Each incoming point is assigned to a cluster, and the centroid is adjusted accordingly.
Mini-batch K-Means periodically processes chunks (batches) of new data, updating centroids based on those chunks. This approach can be scaled to large, continuous datasets.
A potential issue is that clusters might shift over time, especially if the data distribution evolves. The algorithm might stick to outdated centroids if the stream’s characteristics drastically change. One solution is to implement a mechanism that resets or reinitializes some clusters if they consistently represent very few points over time, or if new patterns emerge that don’t fit existing clusters.
Another subtlety is the risk of chasing short-term fluctuations. If the streaming data is noisy, overly frequent centroid updates can make the system unstable. Practical implementations often include smoothing factors or decaying learning rates to balance adaptability with stability.