
ML Interview Q Series: Measuring Slack User Engagement Decline: Metrics, Analysis, and Predictive Machine Learning.

📚 Browse the full ML Interview series here.
What are some metrics you would use to measure user engagement at Slack? How would you be able to tell early whether or not user engagement is declining?
This problem was asked by Slack.
One of the most important things about measuring user engagement at Slack is capturing not only raw activity, such as the number of messages posted, but also the depth and longevity of that engagement, such as user retention over time or the share of users who continue using Slack consistently. Slack is a collaboration tool that supports large enterprises, small businesses, and individual teams; hence, metrics must be informative across all these usage scenarios. Below is a detailed discussion of potential metrics, including how to interpret them in a way that helps identify early warning signs of engagement decline.
User Engagement Metrics at Slack
A useful approach is to think about engagement metrics in terms of activity frequency, depth of collaboration, and distribution across different user segments or cohorts. This means understanding not only how many messages get sent but also how many channels people join, how many files they share, and so on. By layering these quantitative metrics with context (like user or team size, plan type, or industry), Slack can gain deeper insight into engagement patterns.
Daily Active Users (DAU) and Weekly Active Users (WAU)
These are classic metrics that reflect the number of unique users who actively engage with Slack at least once in a given day or week. In the context of Slack, an “active user” might be someone who has opened a Slack client and performed an action (e.g., read a message, posted a message, reacted with an emoji, uploaded a file) within that day or week. Tracking DAU and WAU is crucial because an overall drop in usage frequencies or unique daily visitors often serves as one of the earliest signs of decreased engagement. Analyzing DAU and WAU in tandem may help detect whether a slump in daily use is offset or masked by weekly usage, or vice versa.
Message Volume per User
Looking at the average number of messages posted (or read) per user in a given day or week helps establish how deeply users are actually communicating. Some teams may consistently send a low volume of messages but remain deeply engaged through Slack calls or asynchronous threads, so raw message volume alone cannot be the only indicator. However, if the average message volume or messages read per user significantly drops over time across multiple cohorts, that is a compelling signal of reduced engagement.
Channel Creation and Channel Activity
Slack heavily revolves around the concept of channels, whether they are public, private, or shared channels across organizations. The frequency at which new channels get created can be an indicator of how teams are expanding their usage. A user group actively spinning up new project channels suggests an ongoing need for Slack’s collaboration environment. Conversely, a drop in channel creation might signal stagnation in how teams adopt Slack for new projects. In addition, the level of activity in channels—how many threads per channel, how many reactions on average—tells a more nuanced story about how engaged users are within those channels.
Time Spent or Session Duration
Slack can measure how long each user actively keeps Slack open or how often they switch to the Slack window in a given day. For many knowledge workers, Slack remains open in the background throughout the workday. However, the relevant measure might be the time spent actively reading, writing, or reacting to messages. If active session durations drop consistently, or if you see a trend of users opening Slack fewer times during the day, you can infer that something may be pulling them away from Slack—perhaps alternative communication methods, new competitors, or shifts in workplace behavior.
Number of Integrations Used and App Marketplace Engagement
Slack allows teams to install thousands of third-party integrations, including custom bots and internal automation. The level of interaction with these integrations is a significant measure of engagement depth. A user group that heavily relies on integrated project management, ticketing, or developer tools inside Slack tends to view Slack as an indispensable productivity hub. If usage of integrations or the number of new installs in the app directory starts declining, it might mean that Slack’s role in the overall workflow is beginning to weaken.
Feature Adoption Over Time
Slack has features like Slack Huddles (for quick voice/video calls), Slack Connect (to collaborate with external organizations), and workflows that automate tasks. Tracking how these features are adopted and how usage evolves can illuminate whether new and existing features keep users engaged or if the user base stagnates around basic text messaging. A decline in feature adoption might be an early indicator that Slack is losing its capacity to delight users or address new collaboration needs.
Cohort Retention Analysis
A critical tool in measuring user engagement is the concept of cohort analysis, where you group users based on the time they started using Slack or the plan they are on (free vs. paid). You can then track what percentage of each cohort is still active (sending messages, reading, or reacting) after some time window—e.g., one week, one month, or three months. If retention for each cohort is trending downward sooner or faster than historically observed, that suggests early warning signs of a broader engagement decline.
Share of Users Using Slack for Communication vs. Other Channels
In some cases, large enterprises track the relative usage of Slack compared to email or other messaging tools. Although Slack itself might not always have a direct measure of how many emails are being sent, organizations might measure how many Slack messages are posted relative to the total number of communications within the company. A downward shift in Slack’s share of the collaboration channel mix could indicate Slack is losing out to alternatives.
Early Signs of Engagement Decline
Slack can catch potential drops in engagement early by monitoring the slope of changes in these usage metrics. A stable or lightly fluctuating metric might be normal, but a consistent downward slope across multiple consecutive days, weeks, or months is more concerning. Beyond the raw trends, Slack might consider rates of activity stagnation—for example, how many users drop from high engagement to moderate or low engagement within a short time frame.
Another early warning sign is increased user churn or reduced activation of new signups. If new teams sign up at a typical rate but fewer remain active past the first few weeks, Slack might want to investigate onboarding friction, changes in product-market fit, or competitive pressures. Slack might also look for feedback from Net Promoter Score (NPS) or user satisfaction surveys, especially for enterprise accounts, to see if sentiment correlates with usage.
Teams can further instrument these metrics with anomaly detection. If typical day-to-day usage tends to vary within a known range, but the system picks up on a statistically significant outlier (e.g., usage dropping below the standard deviation range for more than a certain threshold of days), Slack can take early action to figure out what changed.
Detailed user segmentation is also vital. For example, an overall DAU might look stable, but usage among small business customers (or in the Asia-Pacific region) could be in free fall while large enterprise usage is compensating. That difference might mask the early warning signals in high-level data.
Below are some additional considerations:
User-Centric vs. Workspace-Centric Metrics
At Slack, customers can be single users or entire workspaces with thousands of members. A workspace’s activity pattern is often driven by the admins’ behaviors, the nature of the company or project, and external factors. Therefore, measuring engagement both at a per-user level and at a workspace or organizational level is crucial. Large paying customers might churn at the organizational level even if individual usage is strong in certain pockets.
Lagging vs. Leading Indicators
Lagging metrics (e.g., churn rate over the last quarter) might show large effects but arrive too late for Slack to address them. Leading metrics, such as the drop in average messages per active user, or a downtick in the weekly retention of newly onboarded users, can alert Slack earlier.
Qualitative Feedback Channels
Alongside these quantitative measures, Slack can also track signals from support tickets or user feedback. A spike in negative feedback or requests to cancel can serve as an early sign. If support tickets reveal repeated issues that hamper usage—for instance, user confusion about new features or performance concerns—Slack might investigate these problems before they cause widespread engagement declines.
Early Detection Strategies
One common practice is to build an internal dashboard showing real-time or near real-time data for each of these metrics. Statistical process control methods (like a variation of control charts) can be applied to continuously monitor whether usage metrics drift outside of expected ranges. Slack might highlight days that deviate from typical patterns or highlight cohorts that fail to meet baseline retention benchmarks.
By carefully analyzing daily or weekly cohort expansions, Slack can detect subtle changes in behavior. For example, if the typical 2-week retention of new signups is 60% and it suddenly drops to 50% for two consecutive weeks, that’s an early sign that the product or environment has changed in some way. It might be friction in the onboarding flow, a new competitor offering, or a misalignment with new user expectations.
How You Would Tell Early Whether User Engagement Is Declining
To find early signals, you might:
Use a near real-time dashboard that aggregates daily usage metrics (DAU, average messages per user, time spent). Compute new user activation rates and check how many remain active after day 1, day 3, and day 7. Drops here can signal future retention problems. Monitor rolling retention for existing user cohorts. Sudden changes in the shape of the retention curve for recent cohorts often hint at emerging issues. Apply anomaly detection or rolling average thresholding on message volume, Slack calls or Huddles usage, and third-party app usage. Deviations from historical patterns can indicate broadening disengagement. Look for changes in user sentiment (NPS or other satisfaction metrics) to predict future usage declines.
Staying vigilant for these shifts in real time allows Slack to take proactive steps—like outreach to organizations showing usage decline or re-examining the in-product onboarding experience—to mitigate any negative trends before they become severe.
Follow-up Question: How would you analyze user engagement differently for small teams vs. very large enterprises using Slack?
Small teams tend to rely on Slack as an all-in-one communication platform for daily tasks, but the volume of messages or channels is naturally more limited. A small team of 10 users might have a steady message volume that looks low from an absolute standpoint but is still meaningful relative to their team size. Conversely, a large enterprise might have thousands of channels and a wide variety of use cases across different departments.
It is critical to use normalization and segmentation:
Segmentation: You could segment organizations by size, region, industry, or plan type. If a small team with 10 users sees 9 daily active users, that’s a 90% DAU rate. By contrast, a 10,000-user enterprise might be healthy with just 4,000 daily active users, which is 40% DAU but still a large absolute user base.
Engagement thresholds: Large enterprises might have different definitions of “healthy usage.” For them, Slack might be only one of several communication tools. It’s common that not all employees use Slack every day. A small team might show 100% Slack usage daily if Slack is the team’s only channel.
Depth metrics: Instead of just absolute numbers, you examine usage depth, such as messages per user or time spent actively sending messages. For small teams, you might see an extremely high messages-per-user ratio if Slack is the main communication pipeline. For a large enterprise, you might see smaller per-user message volume but a large total volume and more variety in usage patterns.
Cohort-based approach: You can do a retention analysis for small teams and large enterprises separately. For large enterprises, you might want to measure how many sub-teams adopt Slack or how many departments become active. You might also measure how many new integrations or channels are created across major divisions. For small teams, Slack adoption might happen quickly and usage is typically concentrated in a few channels. So the key engagement measure might be usage frequency rather than breadth of usage across many channels.
In practical terms, it is crucial to define separate health metrics for different organizational sizes or segments and track them independently. This ensures you don’t conflate a naturally lower engagement pattern at a large enterprise with a concerning usage decline, or vice versa.
Follow-up Question: If you notice a drop in DAU but your message volume per user remains high, how would you interpret this and what next steps would you take?
If DAU is dropping but message volume per user remains high, it suggests that the remaining active users are still deeply engaged. This dynamic indicates two potential scenarios:
Scenario 1: Core users remain engaged, but marginal users are dropping off. Perhaps the product is used intensely by a subset of power users who rely on Slack heavily, while more casual or peripheral users have found alternative tools or are not logging in as frequently. This signals an erosion of Slack’s broader user base, even though Slack retains a core audience. In this scenario, you might investigate user profiles that have churned or are no longer active, to identify if they share particular characteristics—perhaps they all belong to the same company or team that stopped using Slack. You would also look at user feedback from those who left or are at risk of leaving. Possibly the external environment changed, or Slack’s free plan limitations might have pushed some users away.
Scenario 2: Use-case or product fit is narrowing. Maybe Slack is being used primarily for a few high-intensity channels, like engineering channels or support channels in larger organizations, while adoption in other departments or sub-teams never took off. You would want to see if certain channels or integrations are seeing all the traffic. If that’s the case, it points to a targeted engagement strategy: either highlight cross-team use cases or provide better training or onboarding to other groups.
For next steps, you would segment churned or inactive users to understand commonalities. You might do user interviews or surveys to find out why they are using Slack less often. You might also consider customizing Slack’s user experience or building new features that cater to the lost or under-engaged cohorts. Another step could be re-checking Slack’s pricing tiers—perhaps cost factors or usage caps for the free plan are pushing smaller or peripheral users away.
Follow-up Question: What are some possible pitfalls in measuring long-term user engagement solely based on metrics like DAU/WAU and message volume?
A few pitfalls can arise if you rely on top-level metrics like DAU/WAU and message volume alone:
Pitfall of ignoring context: DAU or WAU might stay stable due to existing large enterprise customers, masking a steep decline in small team adoption. Alternatively, a few large organizations might ramp up usage, hiding churn in many smaller teams.
Pitfall of not accounting for passive usage: Some Slack users might primarily read messages (lurkers) and rarely post. They still gain value from Slack, but might be underrepresented when measuring message volume. DAU/WAU might overcount them, but message volume metrics might undercount them. If you only track message sends, you might incorrectly conclude that these users are not engaged.
Pitfall of focusing only on quantity over quality: High message volumes do not always equate to deep or effective engagement. Some messages can be superfluous, or large amounts of “noise” can dominate certain channels.
Pitfall of not measuring active session duration or feature adoption: Slack is more than messaging. Users might be relying on integrated bots, calls (Huddles), or external app integrations. A message-centric metric might fail to see that users are actively engaged in other Slack features. As a result, you could incorrectly deduce a decline in engagement if message volume goes down while calls or app usage goes up.
Pitfall of ignoring churn and retention patterns: DAU/WAU might remain deceptively steady over a short time window if new users replace those who churn. But if you do not measure retention at the cohort level, you might miss the fact that older cohorts are dropping off at an increasing rate.
To mitigate these pitfalls, you would combine DAU/WAU and message volume with in-depth cohort analysis, user-level engagement funnels (messages read vs. messages sent), active session duration, and feature usage metrics. This multi-dimensional view ensures that you accurately capture how Slack is woven into users’ daily routines rather than just capturing surface-level activity counts.
Follow-up Question: How would you differentiate between normal fluctuations in engagement (like holiday seasons) versus a genuine decline?
To differentiate normal fluctuations from genuine decline, you can rely on:
Historical Seasonality Analysis: Look at historical data to determine typical patterns around holidays or other events. Slack usage might regularly dip on weekends, public holidays, or vacation seasons. If the current dip in usage is comparable to historical dips, it might be a seasonal effect rather than a permanent decline.
Year-over-Year (YoY) Comparisons: Compare the same period across multiple years. If last year in December you saw a 10% dip and this year you see a 30% dip, that’s unusual and might indicate a deeper problem.
Segmenting by Region or Industry: Different industries and regions have different holiday calendars or typical usage patterns. If you see declines in all regions uniformly, it may be a widespread pattern. If it is limited to one region, it could be local holiday effects.
Rate of Recovery Post-Season: If usage normally rebounds within a week after a holiday, but this time remains depressed for multiple weeks, that suggests the decline might be persistent rather than seasonal.
Statistical Forecasting Models: Slack might use machine learning or time series models (like ARIMA or Prophet) to forecast expected usage ranges. If the actual usage falls well below the lower bound of the confidence interval for an extended period, this is more likely a genuine decline than a typical fluctuation.
By combining these approaches, Slack can more confidently identify whether dips are consistent with normal seasonal patterns or if they indicate a more fundamental drop in user engagement.
Follow-up Question: Suppose you’re seeing a strong overall DAU but suspect that the quality of user collaboration has decreased. What metrics and approaches would you suggest to investigate collaborative quality?
You can investigate the richness and quality of collaboration by looking at:
Thread Engagement: In Slack, threads allow for deeper discussion on specific messages. You might measure the ratio of threaded messages to total messages or the average length of a thread. If the system sees fewer threads or significantly shorter threads, that might hint at more superficial interactions.
Cross-Team or Cross-Channel Interactions: Slack is often used to break silos in organizations. If you see fewer interactions across different functional channels or a decrease in channels that have members from multiple departments, that might indicate a drop in cross-functional collaboration.
Reaction Usage (Emoji Reactions): Many Slack teams use emoji reactions for quick feedback. If the ratio of emoji reactions to messages posted has plummeted, it can signal that users are no longer acknowledging or engaging with each other’s content as much.
Slack Calls or Huddles Frequency: If part of Slack’s collaboration includes quick audio or video “Huddles,” you can examine how frequently users initiate or join those calls. A decline in calls might suggest that users have switched to alternative calling platforms or are simply not interacting face-to-face as often.
File/Document Sharing and Collaboration Tools: A dip in the quantity of files shared (relative to the team size) might suggest that Slack is being used less as a collaborative hub for project work. Similarly, if integrated tools for code review or design feedback see reduced usage, it might show Slack’s role in the workflow is weakening.
Survey or Poll Tools: Slack allows the creation of polls or surveys. You can measure whether such interactions are decreasing in frequency or response rate. Declining response rates might suggest lower willingness to engage.
Qualitative Feedback: Ask teams about how Slack fits into their workflow. Maybe a portion of the organization has grown to prefer direct text messaging or email. Or maybe the Slack culture is eroding due to confusion over where to post important updates.
Combining these indicators will give a more holistic sense of how engaged teams remain in terms of constructive collaboration versus merely being present or exchanging quick messages.
Follow-up Question: Which Machine Learning or Statistical Methods Would You Use to Predict Future Declines in Slack Engagement?
Predicting future declines often involves time-series modeling and user-level behavior modeling. Some relevant methods:
Time Series Forecasting: Classic methods like ARIMA, SARIMA, or more contemporary approaches like Facebook Prophet or recurrent neural networks (RNNs, LSTMs) can forecast usage metrics (e.g., DAU, WAU, average messages per user). You feed historical data in, and the model can extrapolate future usage or detect anomalies.
Cohort Survival Models: This is where you look at the probability that a user remains active after certain time intervals. You can do parametric or non-parametric survival analysis. If the survival curve for new cohorts is systematically shifting downward over time, it’s a strong predictor of future declines.
Classification or Regression on User Behavior: You can develop a supervised learning model (e.g., a random forest or gradient boosting model) that predicts user churn. Features might include frequency of messages, usage of specific Slack features, number of team members in the workspace, whether they’ve integrated third-party apps, and so on. The label is whether a user (or workspace) churned in a defined time frame. Once trained, the model can generate churn probability predictions for current users. A spike in predicted churn can be a warning sign of engagement decline.
Change Point Detection: These algorithms try to locate abrupt changes in time-series data. An example is the Bayesian Online Change Point Detection method, which helps identify when the statistical properties of the time series shift significantly. This can be critical for early detection of negative trends or sudden usage drops.
Anomaly Detection: Approaches such as autoencoders, one-class SVM, or robust statistical thresholds can detect usage patterns that deviate significantly from normal. If a metric (like the ratio of new channel creation to total messages) falls outside typical bounds, that might predict future declines in engagement.
After building these models, Slack would monitor dashboards with model outputs. When certain thresholds are crossed—for instance, predicted churn surpasses a certain level or usage metrics are forecast to dip below a standard range—product teams could intervene by exploring user feedback, running targeted promotions, or refining the onboarding process to mitigate that predicted decline.
Follow-up Question: How would you account for potential biases or inaccuracies in your engagement metrics, especially as Slack rolls out new features?
When Slack rolls out new features or changes existing ones, user behavior can shift, potentially introducing measurement bias or confounding effects. To address this:
Instrument the Product Carefully: Before launching a new feature, define the events you want to track (e.g., feature clicks, adoption metrics, subsequent usage). Ensure you have consistent instrumentation so you can interpret data accurately even if user flows change.
A/B Testing and Controlled Experiments: If Slack introduces a new interface, you can do a controlled rollout where only a portion of the user base sees it initially. Compare metrics for those who see the feature vs. those who do not. This approach helps isolate whether engagement changes are truly due to the feature rather than unrelated external factors.
Cohort Analysis for Feature Adopters vs. Non-Adopters: After a full rollout, you can still segment users into those who heavily used the new feature vs. those who did not, to measure any difference in broader Slack engagement or retention. If early adopters show higher or lower retention, that might indicate that the feature had a causal effect.
Monitor Metrics Pre and Post Launch: Keep track of DAU, message volume, channel creation, and other relevant metrics for a few weeks or months before launching a feature, and continue for a similar period afterward. Watch for changes beyond the margin of typical variability or seasonality.
User Education or Onboarding to Avoid Misinterpretation: Sometimes, metrics dip because users misunderstand how to access a new feature or revert to old workflows. You would want to ensure you have user education and documentation so that the potential confusion around new features doesn’t skew usage metrics artificially downward.
Periodic Metric Audits: Slack could systematically cross-check metric data with smaller-scale user surveys or logs from system events. If a new feature’s usage is over-counted or under-counted due to tagging errors, this can be caught by comparing the metrics with actual log files or direct user reports.
By combining these best practices, you reduce the risk of over-reading or misreading the impact of new features on Slack’s engagement metrics.
Follow-up Question: How might Slack’s unique focus on real-time communication and enterprise use complicate measuring or predicting engagement, and how would you handle those complications?
Slack has some unique factors:
Real-Time Collaboration Factor: Slack messages are often short, synchronous bursts of communication. People may remain active but not necessarily “posting” frequently if they’re in a meeting or in focus mode. Predicting usage might be more volatile day to day because real-time collaboration is sensitive to short-term factors (like an urgent crisis in a department that suddenly spikes Slack usage).
External Organizations and Shared Channels: Slack Connect allows external organizations to collaborate in a shared channel. Engagement metrics for these channels are influenced by both sides, which might be on different usage cycles, different Slack plans, or time zones. Tracking usage can become more complex if the external partner’s engagement changes for reasons outside Slack’s direct control.
Enterprise vs. SMB Patterns: Large enterprise usage can be heavily influenced by corporate policies, IT changes, or high-level decisions. Smaller businesses or teams might be more agile and fluctuate usage for more immediate reasons. Aggregating across these drastically different usage patterns can complicate forecasting.
Security and Compliance Requirements: Enterprise customers often have heightened security, logging, or data retention settings. These can sometimes alter how Slack features are used (e.g., restricting file sharing in certain channels). If you analyze file-sharing metrics as part of engagement, it might look artificially low due to these organizational policies.
To handle these complexities:
Collect more granular data so you can break out usage by channel type (regular vs. Slack Connect), plan type (enterprise vs. free tier vs. pro), and region or time zone. This segmentation allows you to see precisely which portion of the user base is driving changes or responding to Slack differently. Use more advanced time series methods that incorporate multiple seasonality patterns (daily, weekly, monthly) and exogenous variables (holidays, major corporate announcements). Partner with enterprise account managers who maintain direct relationships with enterprise customers to gain qualitative context. They can provide insights into any big organizational changes that might affect Slack usage. Track usage in an anonymized but sufficiently granular manner to see which features are used across different compliance or security settings. Then model them separately so that differences in usage policy do not pollute broader engagement metrics.
This level of segmentation and domain knowledge ensures that Slack’s real-time, enterprise-driven nature is factored into the engagement measurement and prediction processes.
Below are additional follow-up questions
How might Slack measure and handle user engagement for ephemeral features, such as “disappearing messages,” where the data is not stored long-term?
Ephemeral features complicate engagement measurement because the platform cannot rely on historical message archives. Messages that disappear after a short period introduce unique challenges:
Data Persistence Challenges: When messages vanish, Slack cannot analyze those messages for content-based engagement metrics (e.g., keyword frequency, sentiment analysis). Historical trends become elusive if the data is not retained. A potential pitfall is that you might underestimate total user engagement if your metrics rely on stored logs. One edge case arises when entire teams primarily communicate via ephemeral messages; you would lack the data to track typical usage patterns like channel discussion depth or average message length.
Proxy Metrics for Ephemeral Usage: Slack can track the creation or activation events for disappearing messages. For instance, you might measure the volume of ephemeral messages initiated over a 24-hour window, or the ratio of ephemeral messages to total messages posted. You could represent this ratio mathematically as:
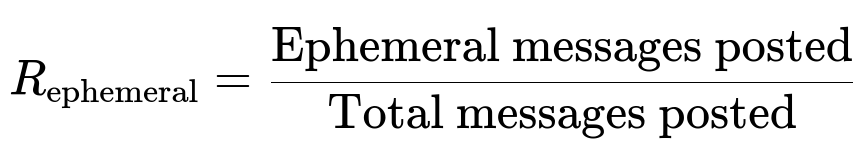
Even though Slack might not retain the message text, it can still log the event that an ephemeral message was created or read. The number of ephemeral messages posted per active user can serve as a proxy for ephemeral feature engagement.
Pitfalls and Edge Cases:
Data Retention Policies: Enterprise customers may have strict policies disallowing ephemeral messages or imposing logging requirements. This could skew your assessment of ephemeral feature usage if only certain teams or industries can enable it.
Overreliance on Partial Logs: If some ephemeral messages vanish before Slack can log engagement signals like reactions, you may have incomplete data on how people responded.
Feature Overlapping: Slack might also have short-lived channels or threads. Distinguishing ephemeral features from other short-lived conversation spaces is essential to avoid double-counting or misinterpreting data.
Approach to Monitoring and Improvement:
Slack could implement specialized event tracking that fires at message creation, display, or reaction—without storing the actual content.
A/B tests on ephemeral messaging experiences might reveal whether ephemeral posts positively or negatively affect general engagement. For instance, if ephemeral usage correlates with reduced engagement in standard channels, Slack might refine user education or feature design.
How would you measure user engagement across multiple Slack clients (desktop, mobile, web) and ensure consistency in reporting?
Slack users often switch among different clients, such as desktop apps, web browsers, and mobile devices. This multi-client behavior leads to:
Cross-Device User Identification: To measure overall engagement accurately, Slack must unify user activity across all devices. A risk arises if Slack attributes activity on the mobile app and the web app to separate user IDs or sessions. Ensuring a single user ID is maintained prevents double-counting DAU or WAU.
Potential Pitfalls:
Session Fragmentation: If a user logs out frequently, Slack may have multiple session IDs for what is effectively the same user in a single day, inflating usage metrics.
Offline Usage and Delayed Syncs: Mobile devices might cache messages offline and only sync back to Slack’s servers intermittently. Activity that happens offline might be registered out of chronological sequence, complicating real-time dashboards.
Push vs. Active Engagement: Merely receiving push notifications is not the same as actively reading or responding. If Slack counts push notifications as “active usage,” you could inadvertently overestimate engagement.
Ensuring Consistency:
Slack’s analytics pipeline should use a robust user authentication and tracking system, ensuring that all client types funnel into a single “source of truth” for user identity.
For real-time usage metrics, Slack might design a near real-time event ingestion system that aggregates data from each client. The pipeline must handle the possibility of delayed or batched uploads from mobile to avoid data skew in short-term engagement dashboards.
A consolidated data warehouse approach, with standardized definitions of active session, message read, etc., reduces inconsistencies across clients. Each client logs identical event types (like “message_sent,” “channel_viewed”) to a unified schema.
How would you handle measuring user engagement in the context of frequent product experimentation, such as rolling out new UI changes or feature flags to small subsets of users every week?
When Slack performs continuous product experimentation—rolling out new UIs, features, or changes to different subsets of the user base—engagement metrics can fluctuate rapidly:
A/B Testing Framework: Slack might keep a master experiment registry. Each experiment defines a target user population, the control and treatment variants, and success metrics. This ensures that Slack does not conflate engagement changes caused by an experiment with broader usage trends.
Key Pitfalls:
Overlapping Experiments: If multiple experiments run at the same time, their effects can overlap or interact. Interpreting engagement changes becomes tricky if you do not isolate which experiment impacted which cohort.
Short-Term vs. Long-Term Engagement Shifts: A new feature might initially spike usage (novelty effect), then usage may settle into a stable pattern. If you measure only the short-term bounce, you may overestimate actual engagement benefits.
Sampling Bias: If Slack inadvertently places power users more frequently in the experimental group, the metrics might not generalize to average users.
Handling Experiments in Engagement Reporting:
Cohort Tagging: Tag each user’s events with an experiment ID (control vs. treatment). Slack can then slice engagement metrics by experiment variant.
Experiment Duration: Allow enough time for usage patterns to stabilize. Slack might track metrics across multiple weeks or months post-treatment to see if a change has lasting impact.
Sequential Testing or Multi-Armed Bandit Approaches: Slack could adopt advanced experimental methods if running many tests simultaneously is essential. Multi-armed bandits automatically reallocate more traffic to successful variants, but you must carefully incorporate these dynamic allocations into your overall engagement metrics to avoid conflating reallocation with real engagement growth.
How would you manage data integrity issues (e.g., data pipeline outages, logging failures) that can distort user engagement metrics and trigger false alarms about user decline?
Data integrity issues can wreak havoc on engagement dashboards if, for instance, logs fail to arrive on time or certain events are missing:
Detection of Data Pipeline Anomalies: Slack should maintain system health metrics in parallel with usage metrics. For instance, monitor events per minute in the ingestion pipeline. If you see a sudden and unexplained dip in events, it might be a pipeline outage rather than a real usage drop. Slack might set up real-time alerts for significant deviations.
Potential Edge Cases:
Partial Outage: Only some organizations or some event types fail to log. This can cause misleading dips in channel creation metrics or message volume, but not in daily active user counts.
Backfill Effects: If data arrives late (e.g., after pipeline restoration), it can inflate engagement numbers on a subsequent day, confusing day-to-day trend analysis.
Human Error in Tagging: A developer might rename or remove an analytics event, causing breaks in historical comparisons.
Recovery and Correction Methods:
Gap-Filling: If Slack identifies a logging gap, it could estimate usage for the missing period by extrapolating from known patterns or partial logs. This is a stopgap measure for dashboards, though it introduces uncertainty.
Flagging Compromised Data: Slack might mark certain time windows as “compromised” in the data warehouse. Analysts are alerted that metrics from that window may be inaccurate.
Robust ETL Practices: Slack’s data engineering team can design nightly or hourly checks verifying event volumes match expected baselines. Automated scripts can attempt to re-process or re-ingest data if anomalies are detected.
Long-Term Smoothing: Weighted moving averages or smoothing methods help mitigate short-term pipeline disruptions from being misinterpreted as real user behavior changes.
If you see a spike in sign-ups (new user accounts) without a corresponding rise in overall DAU, what investigations would you conduct, and what might you suspect?
A sudden increase in sign-ups that does not translate into proportionately higher daily active usage may indicate:
Potential Causes:
Ineffective Onboarding or High Drop-Off: New users sign up but fail to activate properly. They might find Slack’s interface daunting or do not integrate Slack into their workflow.
Promotional or Viral Events: A spike could be driven by external publicity or user curiosity. People create accounts but do not continue usage.
Fraudulent or Test Accounts: Sometimes bots, spammers, or test scripts can create ephemeral accounts. These never convert to real usage.
Technical Glitch in Sign-Up Counting: Slack might be mistakenly counting partial registrations or repeated attempts.
Investigations:
Track Activation Funnel: For each sign-up, measure if the user completes key steps: sets up a workspace, invites team members, sends first message, etc. Identify the point at which new users fail to progress.
Examine Cohort Retention: Compare the retention curve for these new sign-ups to historical cohorts. If the new cohort quickly falls off, that signals an onboarding or expectation gap problem.
Check for Automated or Spam Sign-Ups: Investigate large numbers of sign-ups from the same IP range, suspicious email domains, or obviously faked data.
Surveys or Exit Interviews: Prompt new sign-ups with short surveys about their Slack experience. This can help Slack detect misunderstandings or friction. If they mention difficulties integrating with existing workflow tools, that might require product improvements.
Potential Pitfalls:
Overreacting if the sign-up spike is a short-lived anomaly. If you treat it as a massive growth event and scale resources prematurely, you could have wasted capacity when these sign-ups never fully convert.
Misdiagnosing a sign-up glitch as actual user interest. If Slack funnels are incorrectly configured, you could see “sign-ups” that never complete registration.
How would you measure and mitigate the impact of workspace-level churn on overall Slack engagement when a single large enterprise can drastically shift global metrics by leaving?
Because Slack can serve companies with tens of thousands of employees, the loss of one enterprise customer can cause a notable dip in overall usage:
Measurement Strategies:
Distinguish Individual vs. Workspace Churn: Track churn at two levels: (1) workspace churn—when an entire organization abandons Slack, and (2) user churn—when individuals drop off from an otherwise active workspace.
Weighted Metrics: Slack might separate enterprise usage from small team usage in engagement dashboards. One large enterprise leaving can mask the underlying healthy growth in many small teams. Weighted metrics (like “Enterprise DAU” vs. “SMB DAU”) can give a clearer view of the distribution of usage.
Trend Monitoring by Customer Segment: Slack can maintain separate segmented retention curves for large enterprise workspaces. Observing a single major departure might be an outlier, but a pattern of multiple large customers leaving signals deeper issues.
Mitigation Tactics:
Account Management: Slack typically has dedicated enterprise account managers. Early warning signals (e.g., negative user surveys, steep drop in message volume) can prompt proactive engagement to address a customer’s concerns.
Product Fit Analysis: If enterprise churn correlates with certain product limitations—like security or compliance gaps—Slack can prioritize product improvements to address these needs before large customers leave.
Post-Churn Investigations: Slack might conduct a “churn autopsy” with the departing customer to uncover root causes (pricing concerns, missing features, competitor offerings). This feedback loops back into product strategy.
Pitfalls and Edge Cases:
Overemphasizing One Customer: Focusing too heavily on a single enterprise departure might distract from broader usage trends if that departure was due to unique, unrepeatable circumstances (like a corporate merger).
Multi-Workspace Enterprises: Some enterprises operate multiple Slack workspaces across departments. If only a subset churns, Slack needs to carefully measure partial churn vs. full enterprise churn.
How would Slack analyze the impact of its pricing changes on engagement (e.g., changes to free plan limits or new enterprise tiers)?
When Slack modifies pricing—like adjusting the free plan message history limit or introducing new enterprise tiers—it can profoundly affect engagement:
Direct Impact on Behavior: Free plan users might scale back usage once they near the message limit or file storage cap. Conversely, new enterprise features might spur deeper adoption among paying customers.
Key Investigations:
Upgrade Funnel: Measure how many free plan users upgrade after hitting new usage limits vs. how many reduce engagement or churn. This helps Slack see if the pricing change triggers healthy conversions or drives users away.
Elasticity of Demand: Track how usage volume changes in response to price or quota changes. A drop in engagement could suggest Slack exceeded users’ willingness to pay, while stable or increased engagement could validate the new pricing structure.
Feature Utilization in Higher Tiers: If Slack introduced a new enterprise tier with specialized compliance features, measure whether those features are adopted. If paying customers do not use them, the tier might not be delivering perceived value.
Pitfalls:
Lagged Effects: Users might not instantly leave or upgrade in reaction to a new price. They could continue with existing usage until a renewal cycle or budget planning period. Slack should watch trends over multiple months.
Masking by Macro Trends: If Slack experiences overall growth from marketing campaigns, the negative impact of a price increase might be hidden. Segment analysis is crucial.
Churn vs. Revenue Gains: Higher revenue per user might offset smaller user counts. Slack might need to balance pure engagement metrics with financial metrics. If the goal is profitability, some level of usage drop could be acceptable if it leads to significant revenue gains.
Recommended Approaches:
Evaluate high-level usage trends and also do in-depth cohort analysis around the time of the pricing change.
Survey users (particularly those affected by the new limits) about their likelihood to stay.
Model predicted churn vs. revenue to see if you can identify an inflection point where the new pricing may do more harm than good to Slack’s user base.
How would you incorporate qualitative data (like user surveys, support ticket content, social media sentiment) into your engagement metrics analysis to get a more holistic view?
Quantitative metrics (DAU, messages sent) only tell part of the story. Qualitative data can reveal user sentiment, pain points, or friction that might not show up in raw counts:
Combining Quantitative and Qualitative Signals:
Survey Response Correlation: Slack might survey users on their satisfaction or perceived productivity gains. Then correlate survey responses with user behavior. A user who logs in daily but rates Slack poorly might be obligated to use Slack without truly finding value.
Support Ticket Topics: If Slack sees a spike in tickets about performance or search functionality, that might predict future engagement drops if the issue is not resolved.
Social Media Sentiment: Tools can track Slack mentions on Twitter, LinkedIn, or forums. Negative spikes may foreshadow churn or lower engagement.
Pitfalls:
Sampling Bias in Surveys: Only highly motivated or very dissatisfied users might respond. If you rely exclusively on surveys, you could skew your perception.
Incomplete Coverage of Support Tickets: Enterprise customers often have direct Slack contacts, bypassing the standard ticket system. If you rely solely on public support tickets, you might miss large enterprise concerns.
Ambiguity in Sentiment Data: Social media sentiment analysis can be imprecise. Automated sentiment classifiers can misinterpret sarcasm or domain-specific jargon.
Methods to Integrate Qualitative Insights:
Weighted Models: For predicting churn, Slack can incorporate sentiment scores (from surveys or social media) as a feature in a churn model. A consistently negative sentiment might be a strong predictor.
Representative Sampling: Slack can do random stratified sampling across user segments (new vs. existing, free vs. enterprise) for more balanced survey results.
Closed-Loop Feedback: Cross-reference negative user feedback with actual usage patterns. If a user complains about Slack’s slow performance, check if they reduce logins or messages soon after. This clarifies whether negative feedback correlates with real engagement decline.