ML Interview Q Series: Merging Subset Statistics: Formulas for Combined Mean and Standard Deviation
Browse all the Probability Interview Questions here.
Imagine you have two separate subsets in a dataset, and for each subset you already know the mean and standard deviation. How would you find the overall mean and standard deviation once these two subsets are combined? Can this method be generalized to more than two subsets?
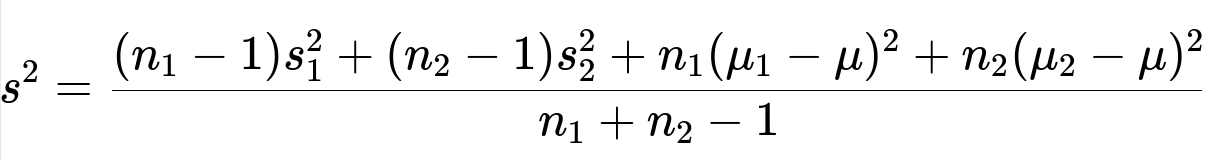
For the combined standard deviation using the sample-based (Bessel-corrected) formula, one approach is to use:
Comprehensive Explanation
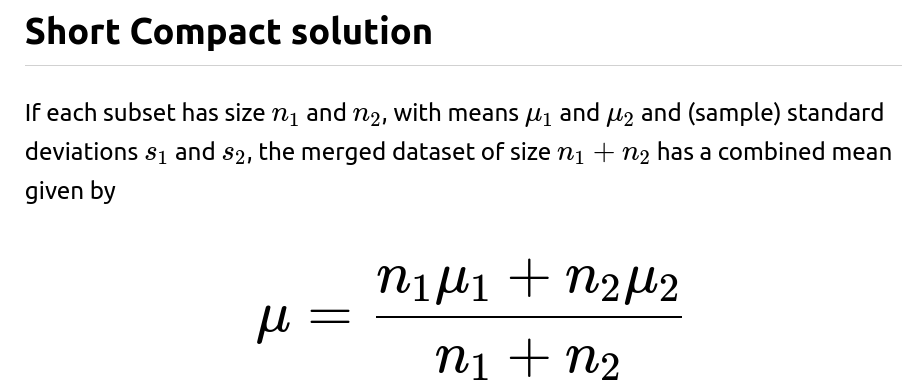
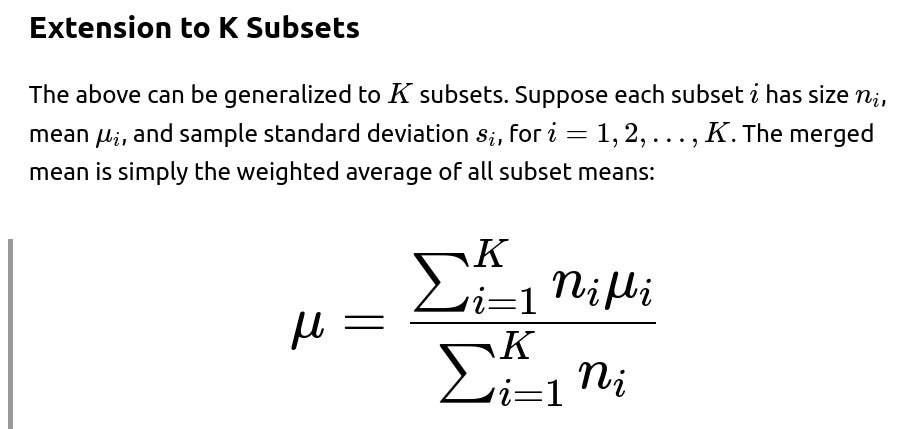
Combining Means
When we merge two subsets into a single dataset, the combined mean should naturally be the weighted average of the two subset means. Specifically:
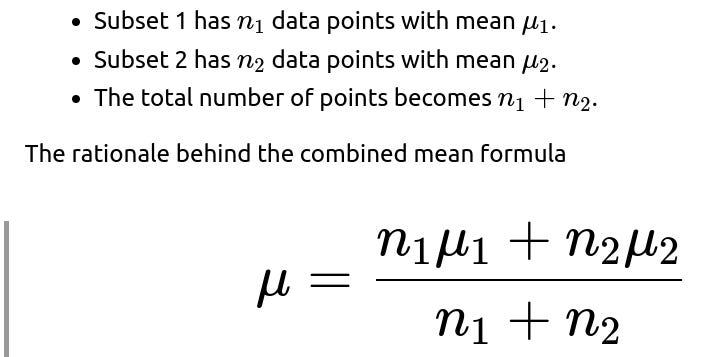
is that each subset’s mean contributes proportionally to how many data points it represents. This result holds for both sample and population means because it merely reflects a weighted average.
Combining Standard Deviations
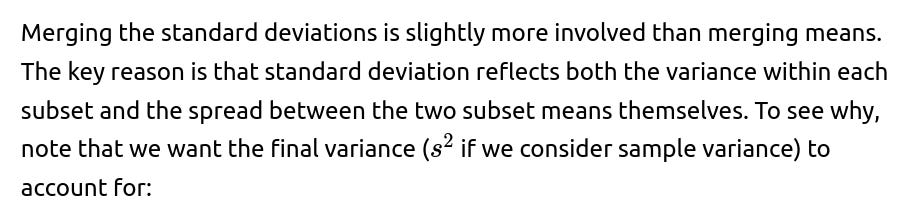
The individual variances within each subset.
The offset of each subset’s mean from the new merged mean μ.
Hence, we use:
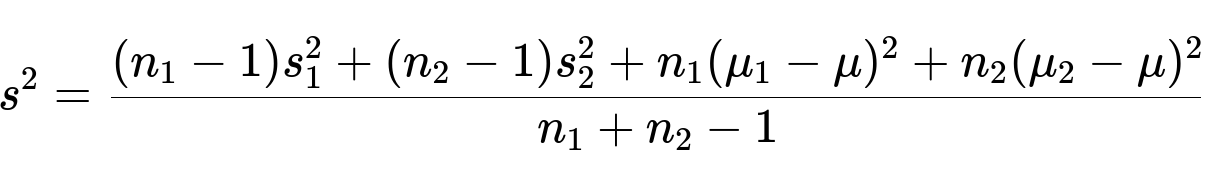
The sample variance for the combined dataset is then given by
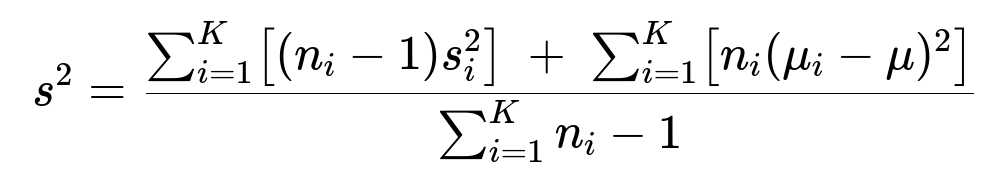
The reasoning is exactly analogous to the two-subset case. We account for within-subset variance as well as the offset of each subset’s mean from the overall mean.
Practical Implementation Details
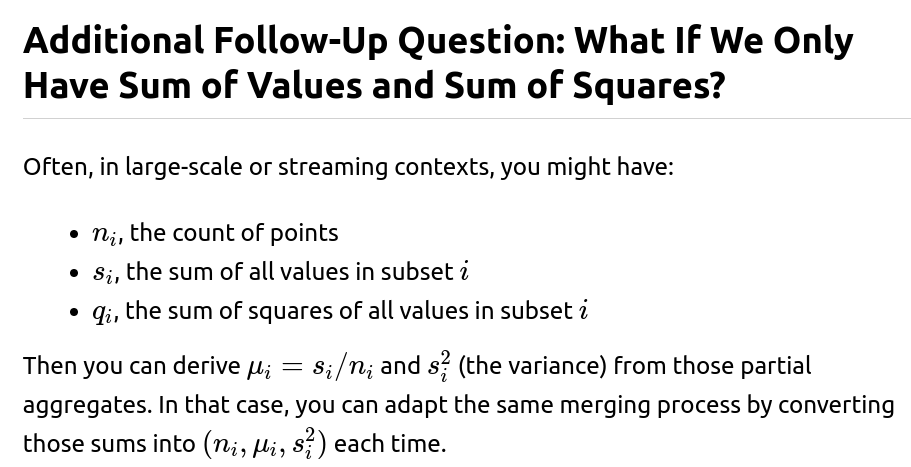
A very common practical scenario is where you need to merge statistical summaries (count, sum, sum of squares, etc.) without directly accessing the entire raw data. By retaining:
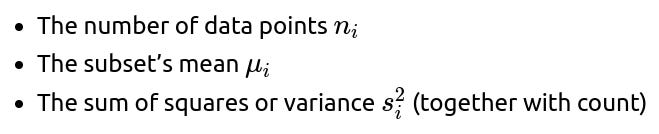
you can merge partial aggregates iteratively. This is often referred to as a “parallelizable” or “online” way of calculating statistics. It is especially useful in large-scale machine learning or distributed systems, where you do not want to gather all data in one place just to compute basic statistics.
Numerical Stability
In real implementations (e.g., streaming algorithms or large-scale data processing), numerical stability can become an issue if the means are very large or very different from each other. To mitigate floating-point problems:

Use stable summation methods (e.g., Kahan summation) if doing incremental updates.
Nevertheless, the formulas described above remain correct. They simply need careful handling in software to avoid floating-point overflow or loss of precision.
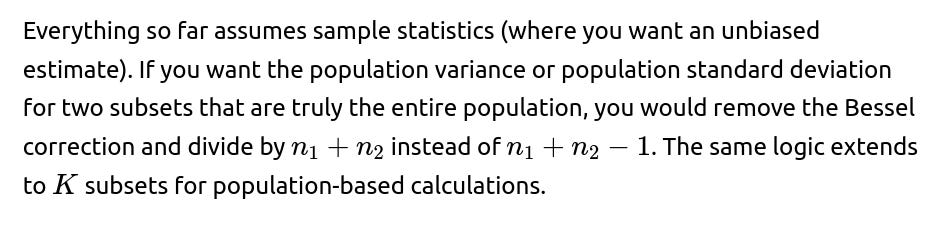
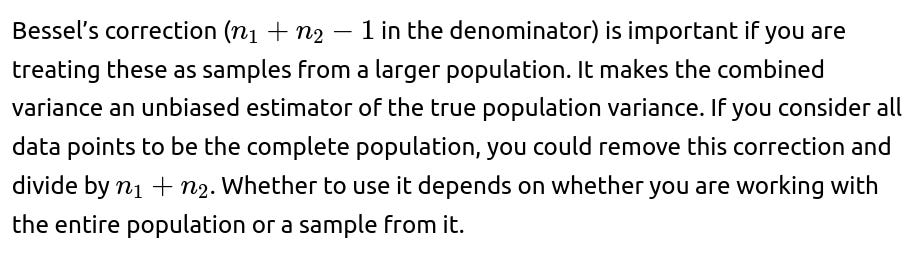
Sample vs. Population Statistics
Code Example in Python
def merge_two_subsets(n1, mu1, s1_sq, n2, mu2, s2_sq):
    # Combined mean
    mu = (n1 * mu1 + n2 * mu2) / (n1 + n2)

    # Combined sample variance
    numerator = (n1 - 1) * s1_sq + (n2 - 1) * s2_sq
    numerator += n1 * (mu1 - mu)**2 + n2 * (mu2 - mu)**2
    denominator = n1 + n2 - 1
    s_sq = numerator / denominator

    return n1 + n2, mu, s_sq

# Example usage
# Suppose subset A: n1=10, mean=2.0, s1^2=0.5
#         subset B: n2=15, mean=3.0, s2^2=0.8
n_comb, mu_comb, s_comb_sq = merge_two_subsets(10, 2.0, 0.5, 15, 3.0, 0.8)
print("Merged size:", n_comb)
print("Merged mean:", mu_comb)
print("Merged variance:", s_comb_sq)
print("Merged std dev:", s_comb_sq**0.5)
You can generalize this code to K subsets by folding them in pairwise (i.e., iteratively merge aggregated statistics from each new subset into the existing summary).
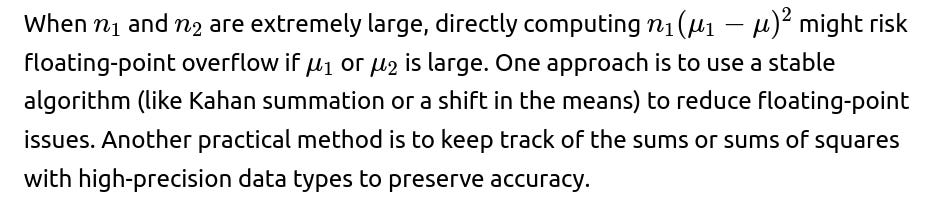
Additional Follow-Up Question: How Do We Handle Very Large Subset Sizes?
Additional Follow-Up Question: How Would This Apply to Online Learning?
In online or incremental learning scenarios (e.g., a continuous stream of data points), you can update running estimates of mean and variance using the above technique, one subset (or even one data point) at a time. Each incoming batch of data or individual data point is treated as a new “subset.” This ensures you do not need to store or reprocess all historical data.
Additional Follow-Up Question: Why Use Bessel’s Correction?
Below are additional follow-up questions
What if the two (or more) subsets we want to combine are not disjoint (i.e., they have overlapping data points)? How does that affect the formulas?
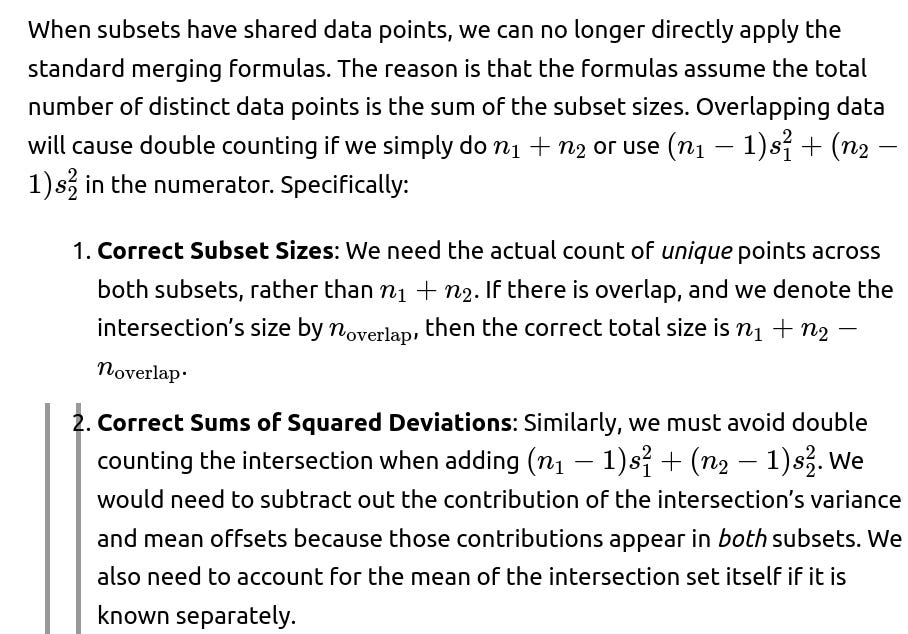
Practical Pitfalls: Often, real-world merging of partially overlapping subsets can arise when data has been aggregated in multiple ways, or there is a time-based overlap. This is not purely a theoretical scenario but can happen if logs or partial aggregates have been stored with some duplication. If you do not carefully handle it, you might underestimate or overestimate the variance.
In practice, you might need either the raw data from the overlap or additional summary statistics for the overlapping portion (like the overlap’s mean and standard deviation). Only with those can you accurately adjust the total sums and sums of squares. Without those intersection-level statistics, you risk double counting and introducing bias in your final estimates.
Does the formula still work if the subsets come from different distributions?
In the strict mathematical sense, the formula for combining means and variances works under the assumption you are treating the entire collection as a single distribution (or sample from a single underlying distribution). If the subsets come from truly different distributions (e.g., distribution A is normal with mean 5 and distribution B is a bimodal distribution with means around 10 and 20), you might want to think carefully about whether combining them as a single dataset is meaningful.
Interpretation of Results: A single mean or standard deviation may be misleading if the subsets differ significantly. You could still compute them, but the resulting combined statistics will not represent a single well-defined distribution. For instance, you might see a broad variance that does not reflect a unimodal spread but rather multiple modes.
Statistical Model Assumption: The formula for combining standard deviations remains valid mathematically if you just treat all data as one pool. But from a practical or inferential viewpoint, the assumption that data is all drawn from the same process is broken. In that scenario, you may instead want to keep the subsets separate or use mixture models to represent different underlying distributions.
Real-World Example: In a recommendation system, if one subset is user ratings for books and another subset is user ratings for restaurants, it might not be meaningful to compute a single global average rating across both. The unit and scale can even be conceptually different. So yes, you can combine them, but interpret the combined statistic with caution.
How do we approach combining medians or other robust measures of spread (like IQR) across subsets?
Combining means and standard deviations is straightforward with the formulas given. However, combining medians or interquartile ranges (IQR) is more complicated:
Medians: There is no direct formula for the median of a union of two subsets that depends only on each subset’s median and size. You would typically need additional information, such as the detailed distribution or cumulative distribution function (CDF) of each subset. Without access to the raw data or at least more elaborate summary statistics (like quartiles or a histogram representation), you cannot exactly compute the overall median.
IQR: Similar to medians, the IQR (the difference between the 75th and 25th percentiles) cannot be derived from just the IQR of each subset. You would need the combined distribution’s quartiles. If you only have each subset’s 25th and 75th percentiles, that still does not let you reconstruct the merged distribution’s quartiles unambiguously.
Approximation Techniques: If truly needed, you could store additional summary data structures (like approximate quantile sketches, e.g., T-Digest or Q-Digest) that make it possible to merge approximate quantile information. These data structures are specifically designed for streaming or distributed scenarios to handle medians, quartiles, etc.
Edge Cases: For extremely skewed data or heavy-tailed distributions, robust measures like medians, IQR, or trimmed means might be more relevant than means and standard deviations. But merging them requires more sophisticated data summaries.
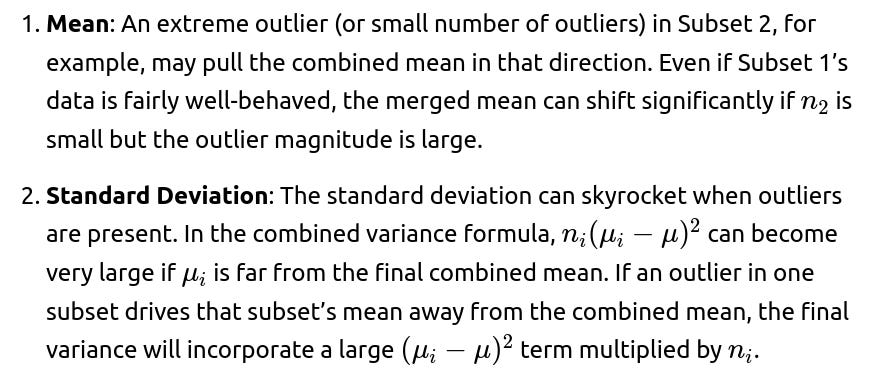
What if there are outliers in one of the subsets? How does that impact the merged mean and standard deviation?
Outliers can heavily affect both the mean and the standard deviation:
Possible Strategies:
Outlier Detection: Sometimes outliers are data entry errors, so we might filter or cap them if justified.
Robust Statistics: Instead of a standard mean and standard deviation, use robust metrics like median and median absolute deviation (MAD). However, as noted previously, merging such measures from subsets is not as simple without additional data.
Transformations: If outliers are frequent but valid, transformations like log-scaling might help reduce their impact on the mean and variance.
Edge Cases: If there is only one extreme outlier in a subset of moderate size, it might not drastically shift that subset’s mean. But if the subset is small and the outlier is extremely large, the effect on the combined statistics could be considerable. Interviewers often ask about the resilience of these formulas to real-world messy data, so it’s important to highlight that the formula itself is correct but might not be robust in the presence of severe outliers.
How do missing values in one or both subsets affect the merging process?
Merging statistics in the presence of missing values requires care:
Identifying Missing Values: If the subsets already have their means and standard deviations computed with some treatment of missing values (e.g., ignoring them or imputing them), you need to ensure consistent policy across all subsets. If Subset 1 used a different imputation strategy than Subset 2, the combined result might be biased or inconsistent.
3. Imputation Effects: Sometimes, missing values are replaced with mean-imputation or other techniques in each subset. Merging these subsets’ means and variances can understate or overstate the true variance, depending on the imputation method. This is because mean-imputation artificially reduces the within-subset variance.
4. Consistent Approach: Ideally, if missingness is present, one might unify the data-cleaning/imputation strategy across all subsets before merging. Alternatively, store the raw or partially imputed data, then compute the final mean and variance from the combined data after a single consistent data preprocessing step. If you only have summary statistics and do not know how missing values were handled, the reliability of combined statistics can be questionable.

Are there privacy or confidentiality issues when merging subsets from different sources?
When data is coming from multiple different institutions or data pipelines, there might be privacy or confidentiality concerns:
Differential Privacy: If each subset has added noise to maintain differential privacy, merging might combine the noise in non-trivial ways, potentially skewing the combined mean and standard deviation. Specialized knowledge of how to handle differential privacy across multiple data partitions is required.
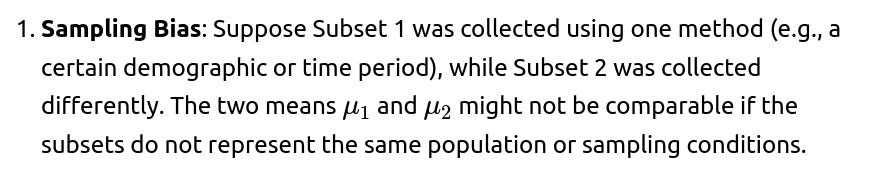
What if we suspect a change in data quality or collection methodology between Subset 1 and Subset 2?
Differences in how data is collected can create biases or shifts that affect combined statistics:

2. Data Quality Differences: If one subset is known to be noisier or of lower fidelity, combining it blindly with a higher-quality subset could degrade the overall data’s reliability. Standard deviation might be inflated by the noisy subset.
Possible Solutions:
Stratification: Keep them separate or combine them only after normalizing or adjusting for known biases.

Subset 1 (for quality reasons), you could artificially reduce its effective size in the formula, but that is no longer a purely “sample-based” approach—it becomes a weighted approach with a non-uniform weighting factor.
Edge Cases: In real-world scenarios, these methods can cause confusion. For instance, if Subset 2 is artificially “down-weighted,” the final combined mean might not reflect a simple average. This can be acceptable if the goal is to reduce the impact of suspect data. Always clarify what “combined statistics” mean in such a situation and whether your approach is truly unbiased or a heuristic to handle data-quality concerns.


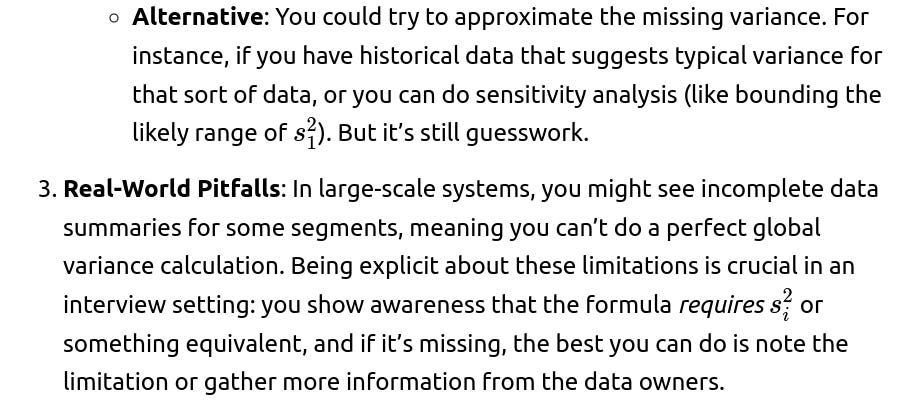
How do we incorporate data if one subset has only the mean (no standard deviation available)?
Sometimes, a data source might only report the mean (for instance, a real-time dashboard that only keeps track of average user count but not the variance). In that case:
You Cannot Fully Combine Variances: To use the standard merging formula for standard deviations, you need each subset’s variance or at least enough information to compute it (like sums of squares). If one subset has no variance information, you cannot compute the final variance accurately.
Partial Solutions:
Assumption: You might assume a variance of zero for that subset if you truly have no data. This is typically not correct, but it is sometimes used in rough approximations, effectively ignoring variability in that subset. The final combined variance will thus be potentially underestimated.

Are there any cases where using the pooled variance formula is strictly incorrect?
The pooled variance formula is sometimes confused with the formula for combining standard deviations in the sense of two-sample t-tests or ANOVA:
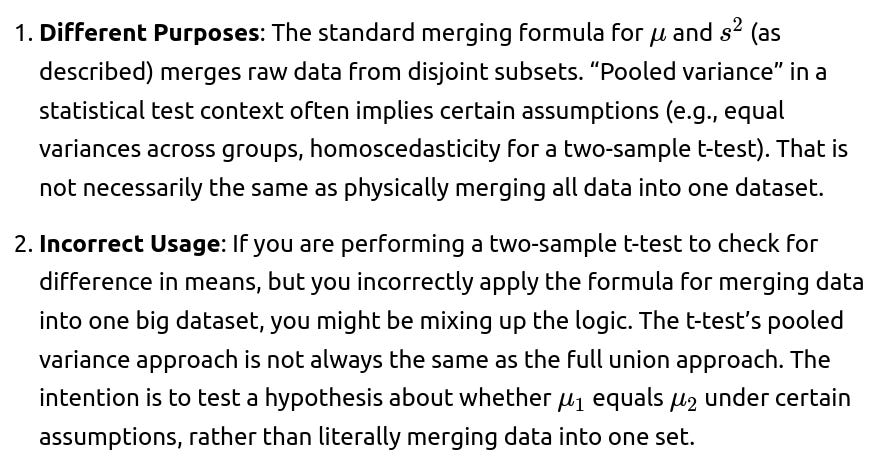
Edge Case: If your reason for combining subsets is for a statistical test, be aware that different formulas or test-specific pooled estimates might be needed. So if you are dealing with a scenario that calls for a classical two-sample t-test with an assumed common variance, it’s not the exact same formula as physically combining all points into a single dataset and computing a variance that way.
What if the subsets have different measurement scales or units?
Sometimes, you have subsets measured in different units. For example:
Subset 1: Temperature in Celsius
Subset 2: Temperature in Fahrenheit
If you just plug in the means and variances without converting them to a common scale, the merged mean and standard deviation will be nonsensical. The potential pitfalls include:
Incompatible Units: A direct combination is meaningless if you do not convert all data to the same scale. For temperature, you might convert everything to Celsius or everything to Fahrenheit before using the merging formula.
Scale Factors: Even if both subsets are in, say, degrees Celsius, but one sensor is systematically offset by some calibration error, you are effectively merging data from two inconsistent measurement systems. This leads to erroneous final metrics. You need to unify or calibrate them first.
Edge Cases: In some domains, partial conversions or approximate conversions might introduce further measurement error. The combined variance might be artificially inflated because the mismatch in calibrations shows up as a “spread.” Always ensure data is on the same measurement scale and has the same reference baseline.
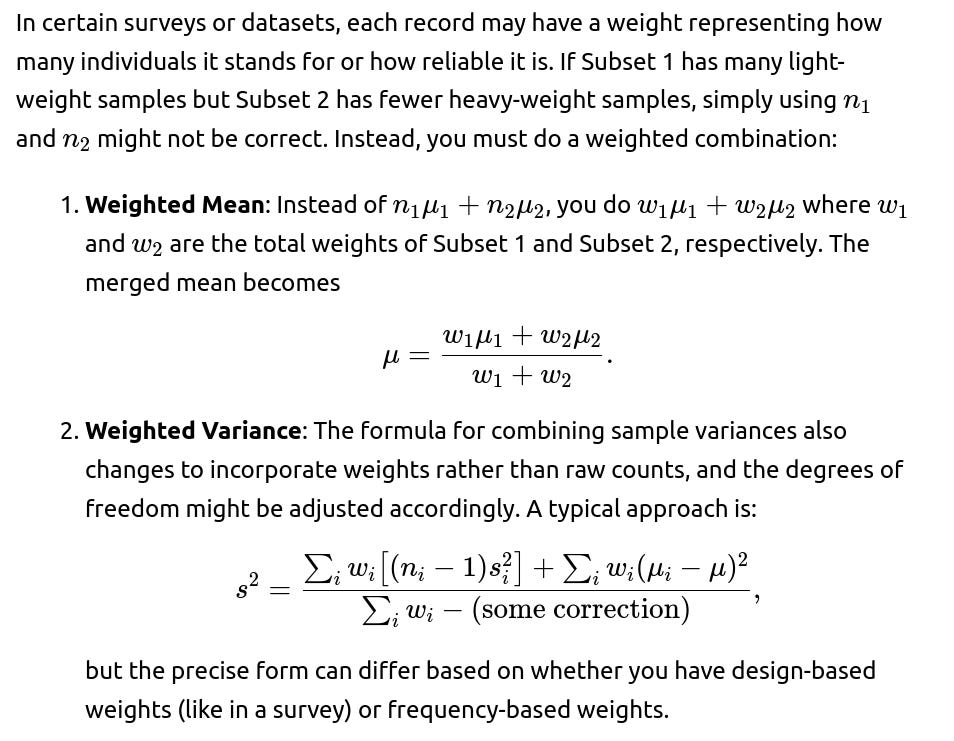
How can we incorporate weighted samples, where each data point in a subset does not carry the same weight?

Pitfalls: Misusing the unweighted formula for data that are truly weighted can cause serious bias. For instance, if Subset 1 is a small random sample of a large population (but each sample is assigned a large weight) and Subset 2 is a big sample with small weights, ignoring the weighting scheme will incorrectly reflect how the data merges.
Real-World Example: Government surveys often use complex weighting schemes to handle oversampling of certain groups, or correct for nonresponse. Merging two such surveys requires very careful weighting logic, not just a naive union.
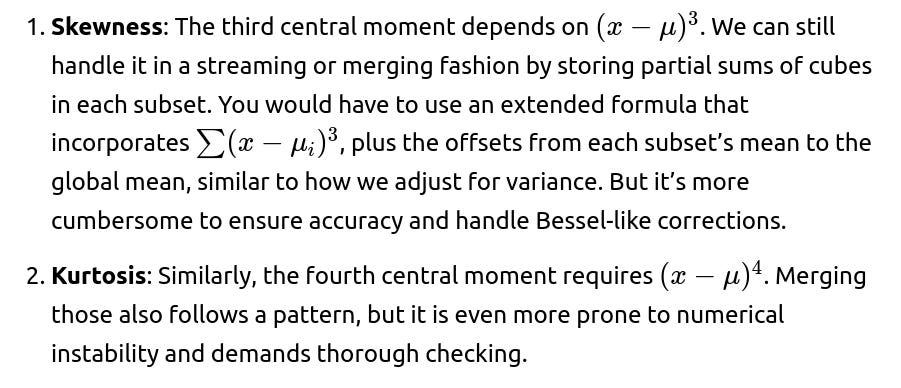
What if we need to track higher-order moments (skewness, kurtosis) across subsets?
Sometimes, to fully characterize or to do advanced statistical modeling, we need the merged skewness or kurtosis, not just mean and variance. Merging formulas get more complex:

Edge Case: If your data is heavily skewed or has heavy tails, ignoring higher-order moments might hide important distribution shapes. However, if your main goal is just to get an approximate idea of the distribution, mean and variance might suffice. If higher-order moments are truly needed for an advanced test or model, then you must keep track of those partial sums or use specialized streaming algorithms.
Practical Usage: In some advanced big data or stream processing tasks (e.g., anomaly detection or advanced distribution fitting), capturing higher-order moments can be valuable. Just be aware that each additional moment increases complexity, and merging them can become prone to floating-point rounding issues for large sums.
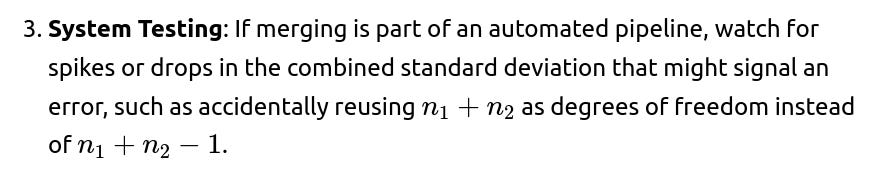
How do we validate that our merged statistics are correct after combining?
Validation is a crucial step, especially in a real production environment:
Small Tests: If you have access to a small portion of the raw data from both subsets, you can compute the combined mean and standard deviation from raw data as a ground truth, then compare it to the merged result from the formulas. They should match closely if done correctly.
Edge Cases: Validate scenarios where one subset is much larger than the other, or where the subsets have very different means. Check if the final variance lines up with your intuition (the combined standard deviation should typically be somewhere near or above the average of the two subset standard deviations, plus a contribution from the difference in means).

4. Consistency: In some advanced analytics platforms, the entire pipeline might be tested by recomputing stats from raw data in a separate environment. Discrepancies can highlight if the merging logic is incorrectly implemented.
These validations not only help catch coding mistakes but also ensure correct conceptual application of the formulas.