
ML Interview Q Series: Precision vs. Recall: Optimizing Classification via Threshold Adjustment.

📚 Browse the full ML Interview series here.
Precision vs Recall: Define precision and recall in a binary classification setting. Why might precision be more important than recall in one scenario (e.g. detecting spam emails), and recall more important in another (e.g. detecting a rare disease)? Discuss the trade-off between precision and recall and how adjusting the classification threshold affects them.
Precision and recall are two fundamental metrics for evaluating binary classification models. They are derived from the confusion matrix, which measures counts of true positives (TP), false positives (FP), false negatives (FN), and true negatives (TN). While accuracy can be deceiving in certain contexts—especially in imbalanced classification tasks—precision and recall provide more insight into a model’s behavior in detecting positive classes.
Precision
Precision is the proportion of predicted positives that are truly positive. If a model predicts 100 items as positive, and 80 of them are correct, the precision is 0.8. Formally:

When we talk about precision, we’re focusing on how trustworthy the positive predictions are. If your model has high precision, it means that when it predicts something is positive, it’s usually correct. Precision is often favored in scenarios where making a false positive prediction is costly or harmful.
Recall
Recall is the proportion of actual positives that the model correctly identified. If there are 100 true positives in the dataset, and the model correctly predicts 90 of them, the recall is 0.9. Formally:

When we talk about recall, we’re focusing on how well the model can capture all the positive examples in the dataset. A high recall means the model rarely misses positive cases. Recall is often favored in scenarios where failing to catch a positive case is far more severe than incorrectly labeling something as positive.
Why Precision Might Be More Important in Some Scenarios (e.g., Spam Detection)
In spam detection, labeling a legitimate email as spam (a false positive) can cause users to miss important communications. If your system regularly places valid user emails into the spam folder, users will lose trust in your model. Therefore, precision is often more important: you want to ensure that whenever your model flags an email as spam, it’s very likely to be spam. The cost of missing some spam is often less severe than the cost of filtering out legitimate messages.
Why Recall Might Be More Important in Other Scenarios (e.g., Detecting a Rare Disease)
In medical applications, particularly for a rare but serious disease, a false negative (failing to detect the disease when it is present) can be far more harmful than a false positive. If your model incorrectly predicts that someone does not have the disease when in fact they do, the person might miss critical early treatment. High recall is essential so that few positive cases go undetected. Even if the model yields more false alarms (i.e., false positives), those can be resolved with further, more detailed medical testing. In such a case, the cost of a false negative is more detrimental, and recall becomes paramount.
The Trade-off Between Precision and Recall
Precision and recall often trade off against each other. A model that tries to maximize precision might label fewer items as positive, only labeling those about which it is extremely confident. This lowers false positives but might increase false negatives. Conversely, a model that tries to maximize recall might label many items as positive, casting a wide net to avoid missing any positives. This strategy inevitably increases false positives, lowering precision.
One practical mechanism to balance this trade-off is to adjust the classification threshold. Typically, in binary classification, a model outputs a probability (or some continuous score) that an instance belongs to the positive class. The common default threshold is 0.5 (i.e., if the probability is greater than 0.5, predict positive; otherwise, predict negative). By changing this threshold, you can shift the balance between precision and recall.
Lowering the threshold (e.g., from 0.5 to 0.3) will make it easier to predict positives, increasing recall (since you’re now catching more potential positives) but typically decreasing precision (because you also bring in more false positives).
Raising the threshold (e.g., from 0.5 to 0.7) will make it harder to predict positives, increasing precision (only the most likely positives are predicted as positive) but typically decreasing recall (because more actual positives fail to meet the stricter threshold).
Balancing precision and recall to achieve an optimal operating point depends on the real-world problem constraints. Techniques like the Precision-Recall Curve or the ROC Curve can be used to visualize how different thresholds affect these metrics, helping you choose the best trade-off for your application.
Follow-up Question 1: How can we choose the right threshold in practice to balance precision and recall?
In many real-world applications, you have to decide what proportion of false positives you can tolerate. This can depend on:
Cost of misclassifications: If a false positive is extremely expensive or damaging, you typically want higher precision. If a false negative is more severe, you want higher recall.
Stakeholders: Different teams (e.g., product, regulatory, customers) might weigh the consequences of false positives vs. false negatives differently.
Performance metrics: You might systematically evaluate the F1 score (the harmonic mean of precision and recall), or other composite metrics like the F2 or F0.5 scores, depending on how you weight recall vs. precision.
Validation with domain data: Often, you’ll measure the model’s behavior on a held-out set and track multiple metrics. You then pick the threshold that meets the business or domain requirements. For instance, if in medical testing the overarching need is to catch nearly all cases, you’ll shift the threshold to prioritize recall.
In practice, you can use a validation set (or cross-validation) to generate precision-recall curves. For each candidate threshold, you compute precision and recall. Then you can choose a point on the curve that meets your acceptable trade-off.
Below is an illustrative snippet showing how you might adjust thresholds in Python using scikit-learn (with a logistic regression model, for example):
import numpy as np
from sklearn.linear_model import LogisticRegression
from sklearn.metrics import precision_score, recall_score
from sklearn.model_selection import train_test_split

# Example dataset
X = ...  # your feature matrix
y = ...  # your binary labels

X_train, X_test, y_train, y_test = train_test_split(X, y, test_size=0.2, random_state=42)
model = LogisticRegression()
model.fit(X_train, y_train)

# Predict probabilities
y_probs = model.predict_proba(X_test)[:, 1]

# Let's define thresholds to try
thresholds = np.arange(0.0, 1.0, 0.05)

best_threshold = 0.0
best_f1 = 0.0

for t in thresholds:
    y_pred = (y_probs >= t).astype(int)
    prec = precision_score(y_test, y_pred)
    rec = recall_score(y_test, y_pred)
    # F1
    f1 = 2 * (prec * rec) / (prec + rec)
    if f1 > best_f1:
        best_f1 = f1
        best_threshold = t

print("Best threshold:", best_threshold)
print("Best F1:", best_f1)
In this example, we iterate over thresholds from 0.0 to 1.0 in 0.05 increments, compute precision and recall, and then check the F1 score. You can adapt this approach to optimize for different metrics or to pick the threshold that best meets a domain-specific requirement.
Follow-up Question 2: Why not simply maximize recall by classifying everything as positive?
If your sole goal is to maximize recall, you could trivially label every instance as positive. In this case, you’ll have zero false negatives (hence recall would be 1.0), but you’ll also have potentially a vast number of false positives. This strategy might be disastrous in scenarios where false positives carry significant costs (e.g., spam detection, fraud detection, or expensive medical tests).
Hence, there’s always a balancing act. You typically can’t ignore precision altogether since real-world systems must consider the downsides of too many false positives, from degraded user experience (spam filtering out important emails) to wasted resources (unnecessary medical tests or interventions).
Follow-up Question 3: Could we rely on accuracy in such imbalanced scenarios?
In many real-world tasks, the classes are highly imbalanced. For instance, detecting spam among regular emails, or detecting rare diseases where the prevalence is very low. Accuracy can be misleading in these cases. If only 1% of emails are spam, a naive model that predicts “not spam” for all emails would achieve 99% accuracy. This obviously doesn’t reflect how well it’s actually capturing spam.
Thus, metrics like precision and recall (and their harmonic combination, the F1 score) are more illuminating. They focus specifically on the model’s performance on the positive class, which is often the one that matters most in these imbalanced situations.
Follow-up Question 4: What is the F1 score, and how does it combine precision and recall?
The F1 score is the harmonic mean of precision and recall. It is defined as:
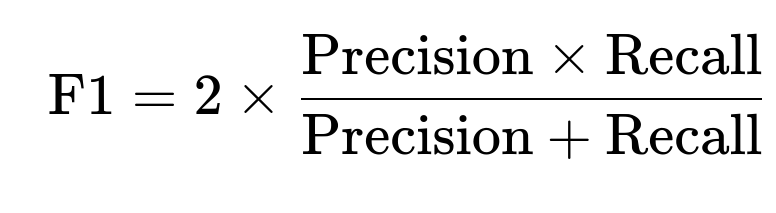
The F1 score balances the two metrics, punishing extreme differences between precision and recall. It is well-suited when you need a single figure that captures how well your model balances precision and recall. However, if business priorities tilt more heavily toward recall or precision, you might consider a generalization of F1 such as the F2 (which weights recall more) or F0.5 (which weights precision more).
Follow-up Question 5: In practice, how do we handle very imbalanced datasets when dealing with precision and recall?
Data-Level Approaches:
Oversampling (e.g., SMOTE) or undersampling to rebalance the classes.
Synthetic data generation to ensure enough positive samples for training.
Algorithmic Approaches:
Use models specifically designed for imbalanced classification (e.g., class-weighted versions of logistic regression or random forest).
Use ensemble methods (like balanced random forests or gradient boosting with class weights).
Evaluation Metrics:
Rely on precision, recall, F1, Precision-Recall AUC (area under the precision-recall curve), or Matthews Correlation Coefficient, rather than plain accuracy.
Practical Threshold Tuning:
Collect predicted probabilities and systematically test thresholds to find a sweet spot that meets business requirements for both precision and recall.
Follow-up Question 6: What techniques can help us visualize the trade-off between precision and recall?
A commonly used tool is the Precision-Recall Curve. Each point on this curve corresponds to a different threshold used for deciding whether an instance is positive or negative. By varying this threshold from 0.0 to 1.0, you get different pairs of precision and recall.
A model that performs well across a range of thresholds shows high precision at relatively high recall values.
If precision drops quickly at moderate recall values, it suggests your model struggles to maintain precision once you become more lenient about classifying positives.
Additionally, you can use the ROC (Receiver Operating Characteristic) Curve, which plots the true positive rate (recall) against the false positive rate. However, when the class distribution is highly imbalanced, the precision-recall curve is often more informative for understanding how well the model is performing on the minority class.
Follow-up Question 7: How might shifting the decision threshold affect a downstream system?
In many organizations, the model outputs are input to other systems or workflows. For instance, a fraud detection model might raise alerts for a manual review team. If you lower the threshold (thus boosting recall), you’ll produce more alerts. That might overburden the fraud investigation team, leading to operational bottlenecks. On the other hand, if the threshold is raised too high, you might only catch the most obvious fraud cases, letting subtle fraud slip through.
Hence, threshold tuning often involves not just model-level considerations, but also how those predictions feed into real-life processes and resource constraints. It’s crucial to track how your threshold choices translate to actual costs, resource usage, or user experience downstream.
Follow-up Question 8: Could calibration techniques help in balancing precision and recall?
Yes. Calibration refers to ensuring that a model’s predicted probabilities reflect the true likelihood of the event. For example, if the model predicts 100 instances with a probability of 0.7, roughly 70 of those should actually be positive if the model is well-calibrated. Techniques such as Platt Scaling, Isotonic Regression, or Temperature Scaling can be used to improve the calibration of probabilities. Once the probabilities are properly calibrated, you can then set your threshold more confidently to achieve the desired balance of precision and recall.
Follow-up Question 9: Are there scenarios where we might optimize for something other than precision or recall?
Yes. Many real-world problems require domain-specific or operational metrics. Examples include:
Cost-sensitive metrics: Each false positive or false negative has a monetary value.
User experience metrics: In recommendation systems, you might focus on top-k precision or recall for recommended items.
Composite/hierarchical metrics: In multi-step pipelines, you might measure the overall pipeline success rate rather than the intermediate classification’s precision or recall.
Precision and recall are key building blocks, but ultimately, your choice of metric should reflect how predictions translate to real-world outcomes.
Follow-up Question 10: Could you give an example of code showing how to compute precision and recall with scikit-learn?
Below is a straightforward example using scikit-learn, illustrating how to compute precision and recall given some test predictions:
from sklearn.metrics import precision_score, recall_score, f1_score
from sklearn.linear_model import LogisticRegression
from sklearn.model_selection import train_test_split
import numpy as np

X = ...  # feature matrix
y = ...  # labels

X_train, X_test, y_train, y_test = train_test_split(X, y, test_size=0.2, random_state=42)
clf = LogisticRegression()
clf.fit(X_train, y_train)

# Predicted labels
y_pred = clf.predict(X_test)

prec = precision_score(y_test, y_pred)
rec = recall_score(y_test, y_pred)
f1 = f1_score(y_test, y_pred)

print("Precision:", prec)
print("Recall:", rec)
print("F1:", f1)
This code snippet trains a logistic regression model, generates binary predictions, and calculates precision, recall, and F1. In practice, you might prefer to work with predicted probabilities (predict_proba) for threshold tuning, rather than simply using the default 0.5 threshold that predict applies.
Below are additional follow-up questions
How do we handle scenarios where the data distribution changes over time (concept drift), and how does that affect precision and recall?
When the data distribution shifts over time (concept drift), the underlying patterns your model learned might no longer reflect the current reality. This can manifest as either a covariate shift (feature distribution changes) or a label shift (the proportion of positives vs. negatives changes), or both. As a result:
Your model’s decision boundary might become outdated. Predictions that were once accurate in terms of precision and recall can start degrading.
A threshold that was optimal for a previous distribution may no longer be ideal if the fraction of positives in the data changes or if the features that best separate classes shift in their meaning.
Possible Pitfalls:
Delayed detection: You might only realize performance has dropped after significant user feedback or a noticeable shift in business metrics.
Overreaction: Adjusting your threshold or retraining too frequently can lead to instability, where your system is always “chasing noise” instead of settling on a robust solution.
Mitigation Strategies:
Regular re-evaluation: Periodically retrain your model (or update its parameters) with recent data. Continuously compute precision, recall, and other metrics to detect drift.
Adaptive thresholding: Rather than fixing a threshold based on older data, dynamically adjust the threshold based on recent performance metrics or an online calibration technique.
Incremental/online learning: Use streaming or incremental methods (e.g., online versions of gradient boosting or logistic regression) so that the model updates continuously and tracks shifts more quickly.
Drift detection tools: Statistical tests or specialized libraries can help identify changes in distribution to trigger model re-evaluation.
How do we consider precision and recall in a multi-class setting, and what additional complications can arise?
In a multi-class setting, you have more than two categories (e.g., dog, cat, bird). Precision and recall become more nuanced:
One-vs-Rest (OvR) approach: You can compute precision and recall for each class (treating it as the “positive” class and the rest as “negative”). You then average those metrics (e.g., macro-average, weighted-average).
One-vs-One: For some algorithms, each pair of classes is compared in multiple binary sub-classifiers. Combining or averaging these binary metrics can be less straightforward.
Potential Pitfalls:
Class imbalance within each class: Some classes may be much rarer than others, so the macro-average could undervalue or overvalue certain classes. Weighted averaging can help, but it might still obscure which classes are performing poorly.
Misclassification between specific classes: A model might repeatedly confuse class A with class B. The overall precision or recall might look acceptable, but for the domain, that confusion could be very costly.
Strategies to Handle Multi-Class:
Macro- vs. micro- vs. weighted- averaging: Decide which averaging strategy best fits your goal (treating all classes equally vs. weighing by class frequency).
Per-class metrics: Always look at per-class precision, recall, and F1 to catch issues in minority classes or classes of highest importance.
Confusion matrices: A multi-class confusion matrix can help visually diagnose which classes are most often confused.
How do we deal with partial or uncertain labels when calculating precision and recall?
In some scenarios (like crowdsourced labeling or medical diagnoses), you might not have a definitive ground truth for each example. Instead, you may have uncertain labels or multiple, possibly conflicting labels:
Soft labels: Instead of a single “positive” or “negative,” you might have a probability or confidence level assigned by annotators.
Consensus labeling: You might take the majority or consensus from multiple annotators, but disagreements could remain.
Pitfalls and Considerations:
Label noise: If a significant portion of your labels are wrong or uncertain, both precision and recall can be misleading. You might be penalizing your model when it was actually correct (or vice versa).
Thresholding for labels: Just as you threshold the model’s output to decide positives vs. negatives, you might need to threshold the label confidence as well.
Measurement of reliability: In medical contexts, ground truth might come from expensive tests. If you rely on partial information or preliminary tests, you could systematically skew your dataset’s labeling.
Possible Solutions:
Confidence intervals: Compute intervals for precision and recall based on the ranges of possible labels.
Re-annotation or gold standard labels: For critical cases, have an expert label subset to evaluate the model’s performance reliably.
Noise-robust methods: Some learning algorithms incorporate label uncertainty directly into the training objective.
In a system where the cost of false positives or false negatives can fluctuate, how should we manage our threshold over time?
Some domains (e.g., e-commerce fraud detection) experience changing economic conditions or shifting adversarial behaviors, leading to fluctuating costs for different mistake types:
Dynamic cost: A false positive might become more costly (e.g., user friction or lost revenue) at certain times of the year. Meanwhile, a false negative might have stable or varying cost.
Cost-sensitive learning: Standard training might not reflect these dynamic costs.
Approaches to Handle Fluctuating Costs:
Regular threshold recalibration: If you know the cost matrix changes seasonally or on specific triggers, recalculate the optimal threshold to balance precision and recall accordingly.
Multiple thresholds: Have different operational modes. For example, a high-alert mode during peak fraud season with a threshold favoring recall, and a normal mode with a threshold favoring precision.
Adaptive weighting: If your algorithm allows class weighting (e.g., logistic regression or boosting), adjust these weights over time to reflect the current cost ratio.
Pitfalls:
Over-fitting to short-term events: You may chase ephemeral changes and degrade overall performance.
Model complexity: If you frequently change thresholds or reweight your model, you need robust monitoring to ensure stability.
What are some best practices for building an ensemble to improve precision and recall simultaneously?
Ensembles—like bagging, boosting, or stacking—often yield better performance than single models. They can help improve both precision and recall:
Diverse base learners: If you combine models that make different types of errors, the ensemble may correct those errors by majority vote or a weighted scheme.
Threshold tuning per ensemble member: You can tune each model separately, then combine their outputs at the probability level.
Calibration: Some ensemble methods (like stacking) can use a second-level model to produce more accurate probability estimates, improving threshold-based decisions.
Potential Pitfalls:
Overfitting: Combining many complex models can lead to overfitting if not validated properly.
Interpretability: Ensembles are typically less interpretable. In regulated industries (like finance or healthcare), understanding the reason for classification can matter.
Computational overhead: Running multiple models can be expensive. If you rely on near-real-time predictions, you must ensure the ensemble can handle the latency constraints.
How can domain knowledge be incorporated to refine precision and recall trade-offs?
Domain expertise often yields insights that pure data-driven methods might overlook. For instance, in medical diagnosis, a domain expert might know that certain symptom combinations almost always indicate a disease.
Ways to Incorporate Expertise:
Feature engineering: Use domain knowledge to create more informative features, improving model discrimination between positives and negatives.
Custom constraints or rules: Hybrid approaches combine model predictions with domain rules, ensuring certain high-risk patterns are always flagged.
Threshold selection: Domain experts can help set an acceptable ratio of false positives to false negatives, guiding threshold selection.
Pitfalls:
Rigid rule sets: Purely rule-based constraints can hamper model flexibility and might degrade performance if the domain changes.
Overreliance on subjective beliefs: Domain experts might be mistaken or rely on incomplete data, so it’s essential to validate with empirical evidence.
How should we measure precision and recall in massive or streaming datasets?
For extremely large datasets or continuous data streams, calculating precision and recall can be logistically challenging:
Memory constraints: Storing all predictions and ground truths might be impossible if your data is growing rapidly.
Real-time evaluation: In some streaming applications, you need near-instant metrics to adjust model behavior (e.g., fraud detection at a payment gateway).
Potential Approaches:
Online metrics: Maintain running counts of TP, FP, FN in a rolling or incremental manner. For each new batch of data, update your confusion matrix counters and compute metrics on the fly.
Sampling: If storing full data is infeasible, sample the stream. Carefully design the sampling scheme to maintain representativeness for both classes.
Window-based evaluation: Use time-based or count-based windows (e.g., last 1,000,000 instances) to compute approximate precision/recall. As data slides, older examples drop out of the window.
Pitfalls:
Skewed data sampling: If the sampling procedure inadvertently under-samples rare classes, your metrics can be biased.
Delayed labels: In streaming scenarios, ground truth labels (e.g., confirming fraud) might only arrive after some delay, making immediate precision/recall estimates incomplete.
How do we handle subtypes within the positive class (e.g., multiple types of rare diseases) when thinking about precision and recall?
Sometimes the “positive” class is itself a collection of different subtypes. For example, “disease positive” could mean one of several rare diseases with different severities:
One-vs-all for each subtype: Treat each subtype as its own positive class, measuring precision and recall. This approach can reveal if you’re detecting some subtypes well while missing others.
Aggregated approach: Combine all subtypes into a single “positive” category if your only concern is whether someone is diseased or not. This lumps together different conditions and might hide subtype-specific performance issues.
Hierarchical classification: You might have a two-stage process: first detect if someone is diseased at all (high recall), then classify which disease subtype.
Pitfalls:
Data imbalance: One subtype may dominate the positive class. The model might learn to bias predictions toward that subtype at the expense of the rarer ones.
Domain cost differences: Different subtypes might have vastly different treatment urgencies. The cost of missing subtype A might be higher than missing subtype B, implying you need a targeted approach.
In real-world pipelines, how do we account for data leakage or shifts between training and production data that impact precision and recall?
Data leakage occurs when information from outside the training dataset influences the model in a way that won’t be available at inference time. Shifts in data processing pipelines or the environment can drastically alter the distribution of features:
Leakage example: Using future data inadvertently in training, so that recall looks very high in validation but collapses in production because that “future knowledge” isn’t actually available.
Shift example: Feature transformations that were valid at training time become misaligned or incomplete in production (e.g., a new feature in production that wasn’t part of training).
Potential Pitfalls:
False sense of security: Your offline metrics might look outstanding, but in production, you see poor precision or recall because the model sees a different data distribution.
Continuous pipeline changes: If engineering teams update the data pipeline, the model’s features might be computed differently, skewing predictions.
Mitigations:
Strict separation of training and inference data: Implement robust data handling processes to avoid contamination.
Re-check pipeline transformations: Verify that every step at training matches the steps at inference. Use the same code or library references to ensure consistency.
Ongoing monitoring: Track precision and recall in production. If you detect unexpected drops, investigate data ingestion or transformation changes first.
What special considerations arise if we apply threshold tuning in an online A/B testing environment?
When you run an A/B test, you might want to evaluate how a new threshold (Version B) performs compared to your old threshold (Version A):
Metrics monitoring: You’ll likely track precision, recall, user engagement, or conversion metrics in near real time.
Selection bias: The population receiving Version B might differ slightly if you do not randomize properly. That skew can affect measured precision and recall.
Time-based factors: User behavior might differ over weekdays vs. weekends, or during seasonal events. A short A/B test might not capture the full picture.
Edge Cases:
Interference: If users receiving different thresholds interact with each other in the same environment (e.g., in a social media setting), their behavior might influence each other’s outcomes.
Low traffic or rare events: If positives are rare, you might need a longer test period to gather statistically significant results for precision and recall.
Best Practices:
Random assignment: Ensure a random, representative assignment to A vs. B.
Sufficient sample size: Use power calculations to confirm you’ll likely see differences in precision or recall with the data you collect.
Long enough test window: Make sure your test runs for enough time to capture typical patterns in your application.