
ML Interview Q Series: Strategic Classification Threshold Selection: Balancing Precision/Recall with ROC & PR Curves.
📚 Browse the full ML Interview series here.
Choosing a Classification Threshold: In a binary classification task (for example, fraud detection or medical diagnosis), how do you decide on the probability threshold for classifying a positive instance? Explain how moving the threshold affects precision and recall. Describe how you would choose a threshold to meet specific business objectives or constraints (e.g., “we need at least 90% recall” or optimizing F1-score) and possibly use techniques like ROC analysis or precision-recall curves to inform this choice.
Choosing a classification threshold in a binary classification problem is critical because it directly impacts the model’s performance metrics (like precision and recall) and, more importantly, the real-world outcomes of deploying that model. Below is an extensive overview of the concepts, strategies, and practical considerations in deciding on an appropriate probability threshold.
Threshold selection is especially important when the relative cost or risk of false positives vs. false negatives is unbalanced, as in fraud detection, cancer screening, or other high-stakes tasks. By default, many classifiers use a threshold of 0.5 for logistic outputs (or “sigmoid” probabilities), but this may not always align with business objectives or domain-specific requirements. Adjusting the threshold higher or lower can help optimize the metrics that matter most in a given scenario.
Understanding Precision, Recall, and Threshold Behavior
Precision and recall are two crucial metrics that are strongly affected by the classification threshold:
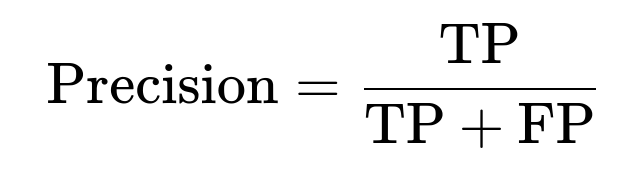
Precision measures among all predicted positives, what fraction actually belong to the positive class. If we denote TP as true positives and FP as false positives:
Recall measures among all actual positives, what fraction are correctly identified:
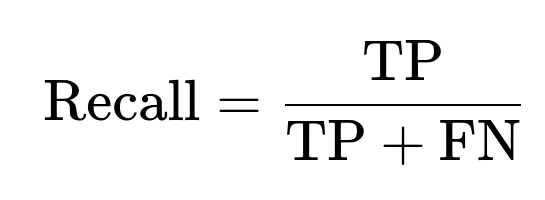
Where FN is false negatives (cases that are actually positive but predicted negative).
When you move the classification threshold:
Lowering the threshold makes it easier to predict positive. This tends to increase recall (fewer missed positives) but often lowers precision (more false alarms).
Raising the threshold makes it harder to predict positive. This tends to increase precision (fewer false alarms) but often lowers recall (more missed positives).
In many real-world use cases (like fraud detection or medical diagnosis), a high recall can be critical. For instance, in medical diagnosis, missing a positive case (i.e., a sick patient) could be dangerous. In other scenarios, high precision may be more important—e.g., if you want to ensure that whenever you flag a user for potential fraud, you are very certain of that fraud.
Core Factors That Influence Threshold Choice
Domain Requirements and Costs of Misclassification In practical applications, the cost or risk of each type of misclassification is rarely symmetrical. False positives in spam detection might be only a small annoyance, whereas false negatives in a cancer detection system can be life-threatening. Understanding domain context is a prerequisite for selecting the right threshold.
Class Imbalance Many real-world problems (fraud detection, rare disease detection, anomaly detection) involve a heavily imbalanced dataset. In such scenarios, the default threshold of 0.5 might produce extremely skewed outcomes (e.g., too many false negatives). Special care in threshold selection can significantly improve performance in the minority class.
Desired Key Metric Depending on whether you want to maximize precision, recall, F1-score, or a custom metric (e.g., cost-based metric), the threshold will be tuned differently. For instance, if your key objective is a recall of at least 90%, you’d choose the threshold that achieves that recall while still balancing other considerations.
Regression or Probability Scores from the Model Different models may output different probability distributions. A well-calibrated model with reliable probability estimates allows more meaningful threshold adjustments. If the probabilities are not well-calibrated, employing calibration techniques (like Platt scaling or isotonic regression) can produce more reliable probabilities.
Tools and Methods for Finding an Optimal Threshold
ROC Curve Analysis A Receiver Operating Characteristic (ROC) curve plots the true positive rate (TPR = recall) vs. false positive rate (FPR) across different thresholds. You can select a threshold that achieves a suitable balance of TPR and FPR according to your domain needs. However, the ROC curve can sometimes give an overly optimistic view when dealing with highly imbalanced data.
Precision-Recall (PR) Curve A PR curve plots precision vs. recall across varying thresholds. This is often more informative for imbalanced datasets. You can pick a point on the PR curve that yields a suitable precision-recall trade-off or meets a recall requirement with an acceptable precision.
F1-Score or Other Composite Metrics The F1-score is the harmonic mean of precision and recall and is often used when both precision and recall are critical, especially if the class distribution is highly imbalanced. You can sweep through thresholds, compute the F1-score for each threshold, and choose the threshold that maximizes F1.
Cost-Based Analysis In some business applications, the cost of a false positive vs. the cost of a false negative can be quantified. You can construct a cost function:
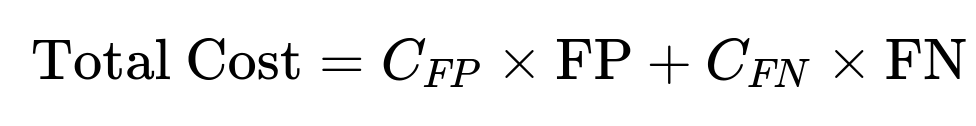
and select the threshold that minimizes the expected total cost. In practice, you can iterate through thresholds, compute the expected cost at each, and pick the one with the minimum cost.
Practical Steps for Threshold Tuning
Collect Predictions and Scores First, run the model on a validation or hold-out set to collect the predicted probabilities for each instance, along with the ground truth label.
Sweep Over Candidate Thresholds Evaluate metrics (precision, recall, F1, cost, etc.) for a range of thresholds. Common practice is to test thresholds in small increments (like 0.0, 0.01, 0.02, …, 1.0) or to use only the unique probability values that the model outputs.
Plot Curves
Plot precision-recall curves and/or ROC curves.
Identify threshold(s) that correspond to desired metrics, such as “recall = 90%” or the best F1.
Check Business Constraints If your use case demands at least 90% recall, identify the threshold value from the precision-recall or ROC curve that gives that recall (or TPR). Confirm the trade-off in precision or other metrics is acceptable.
Validate Against Real-World Outcomes Sometimes, a purely metric-based choice can fail when confronted with real-world test scenarios. Pilot the chosen threshold in a real-world or simulated environment to ensure it aligns with actual business needs, cost constraints, and risk tolerance.
Code Example for Threshold Tuning
Below is a simple example using Python (scikit-learn) to illustrate how you might select a threshold by sweeping over possible values and tracking precision, recall, F1-score:
import numpy as np
from sklearn.metrics import precision_recall_curve, f1_score

# Suppose y_true is the ground truth array of 0s and 1s
# and y_scores are the predicted probabilities from a model

precisions, recalls, thresholds = precision_recall_curve(y_true, y_scores)
f1_scores = []

# Evaluate F1 at each threshold (except the last threshold,
# which is a sentinel in sklearn)
for p, r in zip(precisions, recalls):
    f1 = 0
    if (p + r) > 0:
        f1 = 2 * p * r / (p + r)
    f1_scores.append(f1)

best_index = np.argmax(f1_scores)
best_threshold = thresholds[best_index]

print("Best Threshold for max F1:", best_threshold)
print("Precision at best threshold:", precisions[best_index])
print("Recall at best threshold:", recalls[best_index])
print("F1-score at best threshold:", f1_scores[best_index])
In practice, you may also look at recall constraints (e.g., find threshold achieving recall ≥ 0.90) and then check the resulting precision or other relevant metrics.
How to Choose a Threshold to Meet Specific Business Objectives
If you must meet a specific recall target (like 90%):
Generate a precision-recall curve.
Find the threshold at or above 90% recall.
Evaluate the trade-off in precision or false positives.
Verify business acceptance. Sometimes you may need to be above 90% recall, so you pick the smallest threshold that achieves that requirement.
If your primary objective is to maximize the F1-score:
Calculate F1 for a range of thresholds, as shown in the code snippet above.
Select the threshold that provides the highest F1-score.
If your domain demands a custom cost-based approach:
Derive or estimate costs for false positives (C_FP) and false negatives (C_FN).
For each threshold, estimate total cost.
Choose the threshold that yields the lowest total cost.
If you want to balance multiple constraints (e.g., at least 85% recall but keep false positive rate below 3%):
Calculate multiple metrics at each threshold (precision, recall, FPR, etc.).
Eliminate thresholds that do not meet the constraints (e.g., any threshold that leads to recall < 85% or FPR > 3%).
Among the remaining thresholds, choose the one that best serves your secondary objectives (e.g., maximizing precision or minimizing cost).
Anticipated Follow-up Questions
How do we handle class imbalance when tuning the threshold?
Class imbalance complicates threshold tuning because standard metrics like accuracy or the ROC curve can give misleading impressions. With a heavily imbalanced dataset, the majority class can dominate these metrics. The key strategies include:
Resampling or Reweighting You can oversample the minority class (e.g., SMOTE) or undersample the majority class. Alternatively, assign higher weights to the minority class in the training objective. This can change the model’s probability outputs, often making them more balanced and thus affecting the optimal threshold.
Use the Precision-Recall Curve As opposed to ROC curves, the precision-recall curve often provides a clearer picture of performance in imbalanced scenarios, letting you see precisely how your recall trades off with precision in the minority class.
Consider Custom Metrics or Cost Analysis When your dataset is imbalanced, the cost difference between a false positive and false negative might be even larger. By quantifying this difference, you can set a threshold that truly minimizes cost or risk.
Validate with the Minority Class in Mind Always check recall, precision, or error rates specifically for the minority class. The threshold selection should not inadvertently ignore it.
What if we need to ensure at least 90% recall?
If the requirement is explicitly a minimum recall (e.g., 90%), you typically do:
Plot or compute the recall for many thresholds.
Find the first threshold that achieves at least 90% recall.
Report the precision, F1, or other metrics at that threshold.
Validate whether that threshold’s resulting precision (or false positive rate) is acceptable. If not, you may have to renegotiate the recall requirement or explore techniques to improve the model’s inherent predictive power.
Could you explain how ROC AUC relates to threshold selection?
The ROC curve plots TPR (recall) against FPR at various thresholds. The area under the ROC curve (ROC AUC) summarizes how well the model can separate the positive and negative classes overall. However:
A high ROC AUC indicates that the model ranks positives above negatives well on average, but it does not give you the specific threshold that optimizes your chosen metric.
To find a threshold from the ROC curve, you might look for the point closest to the top-left corner (i.e., maximizing TPR while minimizing FPR). But this “optimal” point might not satisfy specific business constraints.
For highly imbalanced data, the ROC curve might be overly optimistic. The PR curve is often more useful for threshold tuning in such cases.
How do you apply a cost-based approach in more detail?
If you can quantify the monetary or real-world cost of a false positive (C_FP) and a false negative (C_FN), you can compute the expected cost at each threshold:
Compute the confusion matrix for a given threshold to obtain FP and FN counts.
Multiply FP by C_FP and FN by C_FN, then add them to get total cost.
Repeat for multiple thresholds and select the threshold with the minimum cost.
Sometimes, you might combine this with domain constraints (e.g., “false negatives cannot exceed a certain amount”). In that case, you only consider thresholds that meet the constraint and pick the one among them with the lowest cost.
Can we use cross-validation to choose the threshold?
Yes. Typically:
Split your data into multiple folds.
For each fold, train your model on the other folds and compute predictions on the held-out fold.
Sweep thresholds, record your chosen metric (precision, recall, F1, cost) on each fold.
Average the results across folds or pick the threshold that leads to the best average performance.
This helps avoid overfitting to a single validation set when determining the threshold.
How do we set different thresholds for different subgroups or segments?
Sometimes, you have different risk tolerances or costs for different segments (for example, different user demographics, regions, or transaction sizes). You can:
Train one model but apply a subgroup-specific threshold.
Alternatively, train separate models for each subgroup if the underlying distributions differ significantly.
Evaluate each segment’s performance and choose thresholds that match the cost or recall constraints for that specific segment.
What strategies can we use when the dataset is very small?
Small datasets can make threshold tuning less reliable since there is more uncertainty in the performance estimates:
Use cross-validation extensively to get more stable estimates of precision and recall across thresholds.
Consider Bayesian or probabilistic methods that can better handle small sample sizes.
Calibrate your model probabilities if possible, since good probability calibration can help choose thresholds more robustly on limited data.
Be cautious with extreme thresholds, as small sample sizes mean fewer positive examples to confirm your choice.
Could you discuss the relationship between threshold tuning and calibration?
Calibration refers to how well a model’s predicted probabilities align with the true likelihood of the positive class. A perfectly calibrated model means that when it outputs a probability of 0.70, roughly 70% of the time the instance is truly positive.
If a model is well-calibrated, the decision boundary (threshold) can be set in a more meaningful way, because the probabilities themselves are trustworthy.
If a model is not well-calibrated, you could mistakenly set a threshold that yields suboptimal results. For instance, a poorly calibrated model might systematically overestimate probabilities, causing you to misinterpret the threshold sweeps.
Techniques like isotonic regression or Platt scaling can fix calibration issues. After calibration, threshold tuning is more reliable.
How to handle threshold decisions in a real-time system?
Real-time decisions often come with additional engineering and latency constraints:
You might have to choose a threshold that balances both predictive performance and speed. A more complex model might be more accurate but slower.
If the model must trigger manual reviews (e.g., fraud detection), a certain threshold might yield too many positives for the review team to handle in real time. This operational constraint can force you to increase the threshold to reduce the review load.
Continuous monitoring is crucial. You may need to adjust the threshold over time if data drift occurs or if the cost structure changes.
Is there a systematic way to pick a threshold without manually sweeping?
Some methods attempt to optimize thresholds directly during training:
Cost-sensitive training: The model can incorporate the cost of misclassifications directly in the loss function, effectively learning an internal threshold.
Reinforcement learning approaches: In some complex decision systems, threshold selection might be part of a broader policy optimization.
However, the most common and transparent approach remains sweeping thresholds post-training to find the one that meets the performance objectives, because it gives explicit control and interpretability over the final performance metrics.
Below are additional follow-up questions
Could threshold tuning lead to overfitting on the validation set?
Yes, there is a risk of overfitting if you exhaustively search for the “best” threshold on a single validation set without proper regularization or cross-validation. Overfitting in threshold selection can manifest in selecting a threshold that works extremely well for your validation subset but doesn’t generalize. This risk increases when your validation set is small or not representative of the true distribution.
A subtle pitfall occurs when you measure a variety of metrics—precision, recall, F1, cost-based metrics—and keep searching for the highest value among many thresholds. You might end up “fitting” these thresholds too closely to random quirks in your validation data. To mitigate this:
Use cross-validation or multiple splits for threshold tuning. Collect performance metrics across folds, average them, and select a threshold that is robust to different training/validation splits.
Avoid setting the threshold purely based on a single optimum point on the precision-recall curve if your validation set is very small. Instead, use the average or median threshold from multiple folds.
Periodically recheck your chosen threshold on fresh or out-of-time data to ensure continued performance alignment with real-world distributions.
How do we adapt or adjust the threshold as the data distribution changes over time?
Data drift—whether gradual changes in input feature distributions (covariate shift) or changes in how positives vs. negatives manifest (label shift)—can degrade the performance of a fixed threshold. What once gave optimal recall or precision might no longer do so. Key approaches to adapt to changing data include:
Periodic Recalibration: Recompute performance metrics and confusion matrices on the latest data. If precision or recall drops below acceptable levels, adjust the threshold accordingly.
Online Learning or Incremental Methods: Continuously update model parameters and thresholds as new labeled data become available. This might involve partial re-training or a more sophisticated streaming pipeline that self-adjusts.
Monitoring Key Performance Indicators (KPIs): Track false positive rates, false negative rates, or cost-based metrics in real time. If there are sustained trends indicating a shift, trigger an automated or manual threshold re-tuning.
Pitfalls include reacting too slowly (missing big changes) or adjusting the threshold so frequently that you inject noise and degrade stable performance. Effective real-time or near-real-time systems often incorporate robust monitoring and a controlled frequency of updates.
How do we approach threshold tuning if the positive class is extremely rare, such as one in a million?
An extremely rare positive class (e.g., severe fraud detection or rare diseases) poses unique difficulties. A typical validation or test set may have very few positive instances, making it hard to get reliable estimates of recall, precision, or F1. Common pitfalls:
Threshold Over-Sensitivity: Minor shifts in threshold can drastically swing performance metrics if the absolute number of positives is very small.
Uncertain Estimates of Precision: A single false positive might have a large impact on measured precision because false positives can easily outnumber the tiny set of true positives.
Strategies for these edge cases:
Larger or Targeted Data Collection: Acquire or deliberately oversample known positives. This might involve domain experts or specialized data acquisition efforts. Then, correct for oversampling bias if necessary.
Confidence Intervals for Metrics: When the sample of positives is tiny, consider using confidence intervals or Bayesian estimations for recall or precision. This can help quantify the uncertainty in your chosen threshold.
Use Cost-Sensitive Analysis: If positives are extremely rare but extremely costly to miss, define a cost function that puts a very high weight on false negatives. This can guide threshold selection even if direct estimates of recall or precision are noisy.
When might we want to shift the threshold in a pipeline that includes multiple classification steps?
Some complex workflows have multi-stage classification—e.g., an initial classifier to screen out obvious negatives, followed by a second, more detailed analysis on borderline cases. Threshold tuning at each stage might be warranted if:
The first step is intended to aggressively filter out the majority of negatives. A relatively low threshold might ensure high recall in the first stage, avoiding missed positives. A second classifier refines predictions on the remaining subset, potentially using a higher threshold.
There is a business process that demands different trade-offs at different points. For example, step one might aim to reduce workload by removing trivially negative cases, while step two is dedicated to high confidence identification.
Pitfalls can arise if thresholds are poorly aligned. For instance, if the first threshold is too low, you might still pass too many false positives to the second stage, overwhelming resources. Conversely, a too-high threshold early on might discard rare positives prematurely. Careful calibration—often using a small pipeline test set—ensures each stage meets its intended purpose.
If we suspect certain features might lead to systematic misclassification, how can we incorporate domain knowledge when selecting a threshold?
Real-world datasets often contain features whose distributions differ across subgroups or contexts, potentially leading to systematic misclassification if the model relies heavily on these features. Domain knowledge helps you:
Segment Analysis: Evaluate performance metrics by segment or subgroup (e.g., age groups in medical diagnosis) to see if the threshold inadvertently penalizes certain segments. A single threshold might not serve all segments equally.
Feature Importance and Error Analysis: Inspect which features are strongly impacting the model’s scores. If domain knowledge suggests these features can be misleading in certain cases, be vigilant about the threshold for those sub-populations.
Adjusting for Known Biases: Sometimes you can impose a constraint that recall or precision must be above certain levels for each subgroup. This may lead to multiple thresholds or an adjusted cost function that accounts for known biases.
Iterative Feedback from Experts: Domain experts may provide feedback on misclassified examples. If a pattern emerges, you might systematically shift the threshold or remove the offending feature from the model. While removing a feature is a modeling choice, adjusting thresholds is a post-model remedy if you can’t retrain quickly.
What is the difference between using a single, global threshold and a dynamic or per-instance threshold approach?
A single, global threshold means the same cutoff probability applies across all instances. This is the most common approach because it is straightforward and easy to maintain, but it might not account for contextual nuances (e.g., certain user segments, transaction types, or time-of-day patterns).
With a per-instance threshold, you effectively tailor the threshold based on auxiliary information about the instance. For example, transactions above a certain dollar amount might require a stricter threshold for fraud detection. This approach is more complex but can yield better alignment with risk profiles. Key considerations:
Maintenance Overhead: Multiple or dynamic thresholds can be harder to manage and monitor over time. Each threshold might need separate tuning and separate performance tracking.
Potential Data Leakage or Overfitting: If you design instance-level thresholds without careful constraint, you risk using spurious signals that lead to an overly complex system. Thorough validation is essential.
Implementation Complexity: You must maintain logic that decides which threshold to apply per instance. This can complicate real-time systems, especially if thresholds differ by region, device type, or other factors.
Could we do multi-objective threshold optimization in a scenario with competing business objectives?
Yes, real-world applications often have more than one objective. You might want both high recall to catch the vast majority of positives and low false positive rates to avoid operational overhead or user complaints. These objectives can be at odds, making single-metric optimization insufficient. Approaches include:
Weighted Cost Functions: Assign weights to each type of error based on business priorities. Minimizing the total cost can reflect multiple objectives (e.g., cost of false alarms + cost of misses).
Pareto Front: In multi-objective optimization, you may identify thresholds that produce a set of “efficient” trade-offs (no single threshold is superior in all objectives). You then pick a point on this Pareto front based on the domain’s preferred trade-off.
Constraint-Driven Selection: Impose a hard constraint on one metric (e.g., “false positive rate must be below 5%”) and then optimize a second metric (like recall) within that constraint. This approach is common in compliance-heavy industries.
Pitfalls include overcomplicating the tuning process with too many objectives or constraints, which can hamper interpretability. Also, be mindful that real-world data shift can invalidate carefully balanced multi-objective solutions, requiring ongoing monitoring and adjustment.
How do we choose thresholds for multiple classification models that are ensemble-combined or used in parallel?
In some complex systems, multiple models (or an ensemble) may generate probability scores, which are then combined (e.g., via averaging, weighted averaging, or stacking). Deciding a threshold in these scenarios often involves:
Determining an Ensemble Score: If you average or otherwise combine model probabilities into one final probability, you can apply a single threshold to the combined output. Tuning that threshold is typically done in the same manner as a single model, but the synergy among models might shape the final distribution of scores.
Per-Model Thresholding: In other cases, each model might have its own threshold. If any model crosses its threshold, you flag the instance as positive. This approach can raise recall but might lower precision. Conversely, you could require multiple models to agree on a positive classification.
Weighted Threshold Approaches: You might define rules such as “model A has proven more accurate historically, so if model A’s probability is above T_A, we predict positive, otherwise we rely on model B’s threshold.” These rules can get complicated, so cross-validation for each scenario is essential.
Pitfalls include logically inconsistent rules if you set thresholds in isolation. For instance, you could end up with contradictory outcomes if you do not carefully unify the thresholds in an ensemble or multi-model system. Thorough testing on a validation set that simulates final real-world usage is essential before deployment.
How do we handle threshold selection if some data labels are uncertain or partially labeled?
In certain industries—like medical scenarios with preliminary diagnoses or user-reported labels—the ground truth might be noisy or only partially known. This uncertainty complicates threshold tuning because your “positives” and “negatives” in training or validation might not be fully accurate. Strategies:
Soft Labeling or Confidence-Weighted Labeling: If some labels are more certain than others, treat them differently in training and threshold evaluation. For instance, weight them more heavily if you trust them.
Robust Evaluation: Use multiple label sources or repeated labeling (like an expert committee or crowdsourcing) to reduce individual labeling noise. Cross-check threshold performance with different “layers” of ground truth.
Conservative Threshold Selection: If label noise is suspected to systematically create false positives or false negatives, set thresholds more conservatively in line with domain knowledge. For example, if you know many positives might be mislabeled as negative, you might lower the threshold to ensure higher recall.
Pitfalls include incorrectly assuming all uncertain labels are random noise. In reality, mislabeled instances might be systematically biased, leading to skewed threshold decisions. An iterative approach that refines labels or leverages expert review can help.
What about threshold selection under adversarial conditions, such as fraudsters actively changing their patterns?
In adversarial contexts (e.g., fraud or spam detection), the positive class (attackers, fraudsters) adapts and evolves to circumvent detection. A threshold that works today may be easily bypassed tomorrow. You often need:
Continuous Monitoring: Watch changes in the score distribution among known positives. If fraudsters learn how to reduce their predicted probability (stay below your threshold), you may need to adjust it or retrain the model with new examples of these attacks.
Rapid Model Updating: Incorporate newly identified attacks into training data or a specialized online learning mechanism.
Multiple Layers of Defense: Relying on a single threshold is risky in adversarial domains. You might have multiple features or heuristic rules that trigger additional reviews even if the probability score is below the threshold.
A key pitfall is complacency—believing a certain threshold will remain effective indefinitely in a dynamic adversarial environment. Proactive retraining, threshold re-selection, and cross-functional (security, fraud analysis) collaboration are crucial.