
ML Interview Q Series: Testing Coin Fairness: Binomial Hypothesis Test for One Head in Ten Flips.

Browse all the Probability Interview Questions here.
If you flip a coin ten times and see exactly one head, how would you set up the null hypothesis and compute the p-value to check whether the coin is fair?
Short Compact solution
The null hypothesis states that the coin is fair, meaning its probability of landing heads is 0.5. The alternative hypothesis is that the coin is not fair (its probability of heads differs from 0.5). Because the sample size is only 10 flips, we cannot rely on a normal approximation, so we directly use the binomial probabilities.

Comprehensive Explanation
Understanding the Hypothesis Setup
When testing whether a coin is fair, we formulate:
Null Hypothesis (H0): The coin’s probability of heads is 0.5.
Alternative Hypothesis (H1): The coin’s probability of heads is not 0.5.
This is typically a two-sided test, because we are interested in detecting bias whether it favors heads or tails.
Binomial Distribution for Coin Flips
For a fair coin, each flip is a Bernoulli trial with probability p=0.5 of landing heads. When we flip the coin n times (here, n=10), the number of heads X follows a binomial distribution:

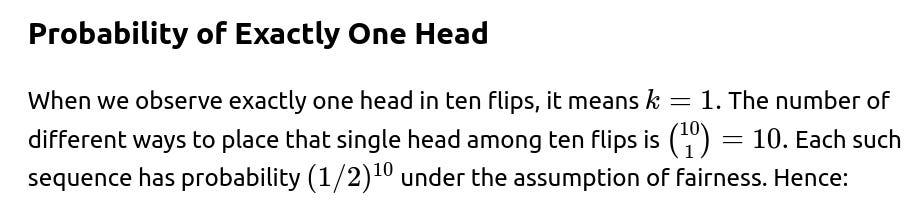

This value, 0.0098, tells us how likely it is to observe exactly one head if the coin truly is fair.
Interpreting the p-value
Reason for Not Using the Normal Approximation
Sometimes, when the number of flips is large, we approximate a binomial distribution using a normal distribution. But with only 10 flips, the sample size is too small to safely apply the Central Limit Theorem. It’s more accurate to rely on the exact binomial probabilities.
Conclusion from the Test
Since 0.0098 < 0.05, we typically conclude that one head in ten flips is sufficiently unlikely under the assumption of fairness. Thus, we reject the null hypothesis and infer that the coin’s probability of heads is probably not 0.5.
Possible Follow-Up Questions
How would you modify the test if you suspected the coin might have a probability of heads greater than 0.5 (or less than 0.5)?
In that case, you would set up a one-sided alternative hypothesis:

Then you would calculate the probability of observing k heads at least as extreme in the direction of interest (e.g., k or more, if you are testing for p>0.5). If that probability is below the significance threshold, you would reject the null hypothesis in favor of the one-sided alternative.
Why not approximate the binomial distribution with a normal distribution here?
The normal approximation to the binomial is generally used when n is large enough and p is not too close to 0 or 1. A common guideline is that both np and n(1−p) should be at least 5 to apply the Central Limit Theorem with reasonable accuracy. For n=10 and p=0.5, np=5 and n(1−p)=5, which is borderline. More importantly, in an exact test with such a small number of trials, the binomial formula is straightforward to compute, so relying on an approximation is unnecessary and could be less precise.
If only one head in ten flips leads us to reject fairness, what does that imply about Type I and Type II errors?
A Type I error (false positive) would occur if you conclude the coin is biased when it is actually fair. At a significance level of 0.05, you are accepting that there is up to a 5% chance of rejecting the null hypothesis when it is, in fact, correct.
A Type II error (false negative) would occur if you fail to reject the null hypothesis (decide it’s fair) when in reality, the coin is biased. The probability of a Type II error depends on the true bias of the coin and the test’s power. With more extreme biases, the probability of seeing such rare outcomes (like 1 head out of 10) becomes less improbable, and you are more likely to detect that bias. However, if the coin is only slightly biased, you might not gather enough evidence from a small sample to reject the null, which would increase the chance of a Type II error.
How would the p-value calculation change if we wanted the two-sided test to account for extreme results on both ends (few heads or few tails)?
For a two-sided test at the extremes, you typically consider:
P(X≤1) plus P(X≥9) since 9 heads or 10 heads are similarly “extreme” but in the opposite direction.
In that scenario, you would calculate:
P(X=0)
P(X=1)
P(X=9)
P(X=10)
and sum them all. That sum would be your two-sided p-value. Practically, for this example:

This two-sided approach still yields a probability under 0.05, which would also reject the null hypothesis.
Is one experiment with ten flips sufficient to conclude the coin is biased in practice?
Statistically, you can reject the null hypothesis at your chosen significance level with such evidence. However, from a practical or business perspective, many real-world scenarios would prompt you to repeat the experiment with more flips to confirm the finding. Small sample sizes can be misleading due to higher variance. Practitioners often prefer more data to reduce uncertainty and ensure that the result is reliable over repeated trials.
How might you approach this test in a programming context?
In Python, you could calculate binomial probabilities directly using libraries such as
scipy.stats. For example:from math import comb import numpy as np # Probability of exactly one head under a fair coin p = comb(10, 1) * (0.5**10) print("Probability of exactly 1 head out of 10 flips:", p)Or, for a more general approach with
scipy:import numpy as np from scipy.stats import binom # Probability of k heads out of n flips with probability p k = 1 n = 10 p = 0.5 prob_exact = binom.pmf(k, n, p) print("Binomial PMF for exactly 1 head out of 10:", prob_exact) # For a two-sided test for 1 or fewer heads, or 9 or more heads: prob_extreme = binom.cdf(1, n, p) + (1 - binom.cdf(8, n, p)) print("Probability of extreme outcomes (<=1 or >=9):", prob_extreme)Such a code snippet clearly demonstrates how to obtain the probability and the p-value in a straightforward manner without approximations.
Below are additional follow-up questions
How would you approach testing fairness if you have prior knowledge about the coin, such as a suspicion that it might be heavily weighted?
A Bayesian approach can incorporate prior beliefs about the coin’s bias. Instead of framing the coin’s probability of landing heads as a fixed unknown parameter p with the null hypothesis p=0.5, you would place a prior distribution on p (for instance, a Beta distribution) that encodes any initial suspicion about possible biases. After observing data (e.g., 1 head in 10 flips), you update this prior to a posterior distribution over p using Bayes’ theorem.
In a Bayesian setting, you might compare the posterior probability that p is near 0.5 against the probability that p is substantially different. This can be more flexible than a frequentist p-value because it directly quantifies the degree of belief in particular ranges of p.
A subtlety is selecting a meaningful prior. If you have little real information, you might choose a uniform Beta(1, 1) prior, which represents no strong preference for any particular bias. If you believe the coin might be significantly skewed, you might use a prior like Beta(2, 8) to reflect that initial skepticism (more belief in p being closer to 0.2). The final results strongly depend on this choice, so the main pitfall is that an inappropriate prior can overshadow the actual data, or conversely, the data might be too limited to override a strongly held prior belief.
Can we construct a confidence interval for the coin’s true probability of landing heads based on 1 head in 10 flips?
Yes. A common way is to use a frequentist approach with a binomial confidence interval (for instance, the Clopper-Pearson interval). This exact interval avoids normal approximations and directly computes the lower and upper bounds for p that are consistent with observing 1 head in 10 flips at a chosen confidence level (e.g., 95%).

A pitfall is misinterpretation. A 95% confidence interval doesn’t mean there is a 95% chance that p is in that interval. Instead, it is a procedure that, if repeated over many experiments, would cover the true parameter 95% of the time. Another subtlety is that with only 10 trials, the interval might be quite wide, reflecting high uncertainty. This wide interval is not necessarily a sign that the coin is fair; it more strongly indicates that more data would be needed for a precise estimate.
What if the flips themselves might not be independent? Could that invalidate the binomial test?
If consecutive coin flips are somehow correlated—for instance, the way you flip the coin each time is influenced by prior outcomes—then the binomial model is no longer strictly correct, because the binomial distribution assumes independent Bernoulli trials.
One consequence is that the p-value derived from a binomial assumption could be inaccurate. You might have either overstated or understated the likelihood of observing 1 head in 10 flips, depending on how the flips are correlated. For instance, if you systematically flip the coin more gently after seeing too many heads, you might unknowingly skew subsequent outcomes.
A real-world example of such a pitfall is using a mechanical coin flipper that introduces dependencies between trials. To address it, experimenters try to ensure each flip is performed in a uniform, randomized manner and that the flips are physically or procedurally isolated from one another. If dependence is suspected, more advanced statistical models (e.g., Markov chain-based approaches) can be used to test for bias.
What if the coin is part of a set of trick coins with different biases, and you randomly selected one coin from the set?
In that scenario, you aren’t just testing the fairness of a single known coin; you’re testing the fairness of whichever coin you happened to draw. If the set includes coins with varying biases, you essentially have another layer of randomness on top of the flipping outcomes. This is sometimes referred to as a hierarchical model, where each coin has its own probability of heads, and you pick one coin from the distribution of these probabilities.
A straightforward test that treats the selected coin as if it were a single coin with an unknown p might still be valid for detecting extreme cases of bias. However, you lose clarity about whether the apparent bias arises from the particular coin you chose or from the overall distribution of biases in the entire set. A better approach could be to incorporate prior knowledge about how coins in the set are distributed in bias and update that distribution with the observed data (a Bayesian hierarchical model). A pitfall here is ignoring the selection process and incorrectly interpreting the test result as “the coin is biased” when in reality you might have selected one of the more extreme coins from the set.
Could repeated testing with the same coin lead to issues like multiple comparisons?
Yes. Suppose you flip a coin 10 times, see an unexpected result (like 1 head in 10 flips), and decide to test fairness. Then you continue flipping the same coin more times, each time applying a new test at some significance level (like 0.05). Over multiple tests, the probability of at least one false positive increases, unless you adjust for multiple comparisons.
Common adjustments include the Bonferroni correction or the Benjamini-Hochberg procedure if you are doing many tests and want to control the family-wise error rate or the false discovery rate. A subtle pitfall is that repeated ad-hoc testing after each set of flips can inflate the chance of incorrectly declaring bias at some point. A better approach is to plan a single test with a predetermined number of flips or use a sequential testing method that explicitly controls the Type I error rate across multiple looks at the data.
How do we reconcile statistical significance with practical significance in real-world scenarios?

A pitfall is focusing on p-values alone without considering the real-world effect size or context. In practice, you might want to estimate how big the bias is and determine whether it is large enough to warrant intervention (e.g., discarding the coin). You might also consider the costs or impacts of a biased decision in a particular setting.
What if the coin shows 1 head out of 10 flips, but we suspect that was simply an anomaly and do not want to immediately discard the coin?
One approach is to perform a power analysis to see whether 10 flips is sufficient for the level of certainty you need. If the test is underpowered—meaning it has a high chance of a Type II error (failing to detect a real bias)—you might need more flips to confirm the result.
Another approach is to replicate the experiment. If you flip the same coin another 50 times and the distribution of heads versus tails moves closer to 50–50, that might restore confidence in fairness. A major pitfall is making a conclusion on very little data. Ten flips might be too few to conclusively label a coin as biased in many real-world contexts unless the cost of being wrong is very high.
How might partial knowledge of the physical properties of the coin or the flipping technique affect the hypothesis test?
If, for instance, you know the coin is physically symmetrical but suspect your flipping technique (like always flipping it from the same side in the same manner) introduces a systematic lean to land on tails, this knowledge might shift your interpretation of the observed data. You might suspect the bias arises from technique rather than from the coin’s intrinsic weighting.
In classical hypothesis testing, you generally don’t differentiate between the “mechanical flipping bias” and the “coin’s physical bias.” Both lead to the same outcome probabilities. But from a practical standpoint, identifying the root cause is crucial. If you can fix your flipping method, the coin might still be fair. A subtle pitfall is that ignoring mechanical influences can lead you to incorrectly conclude the coin is biased when it’s actually just the flipping approach that is at fault.
If the results are borderline (e.g., p-value = 0.049 vs. 0.051), how do you address the arbitrariness of the 5% significance threshold?

How do you handle a situation where you suspect the coin might have multiple faces that are not standard, or it’s a novelty coin with unusual geometry?
If a “coin” is not truly symmetrical (e.g., a coin with an extra groove or weighting in the rim), standard binomial assumptions still apply if each toss remains a Bernoulli trial with some unknown probability p of landing “heads” (however that is defined). But if the geometry leads to inconsistent or environment-dependent probabilities, each flip might not have the same p.
In that scenario, it’s more complex to define a single p for the entire experiment. One approach is to treat each flip’s probability as potentially different and build a more general model—though that usually requires more data or domain knowledge about how the geometry influences each flip. A pitfall is ignoring these complexities and using a simple binomial test that might be inaccurate if p changes from one flip to another.


