
ML Interview Q Series: Using a query, how do user interactions (likes/comments) correlate with higher purchase rates?

📚 Browse the full ML Interview series here.
Comprehensive Explanation
The main idea is to measure purchase “conversion” among two user groups: those who have engaged (liked or commented) and those who have not. In a typical scenario, the users table provides user IDs and other information (e.g., signup date), the transactions table stores purchase data, and the events table records user actions on the platform, including any "like" or "comment" actions.
A straightforward approach is to:
Identify which users performed a like or comment.
Join this information with the users table.
Join transaction data to see if each user purchased anything.
Compare the ratio of purchasers to total users between the interacting group and the non-interacting group.
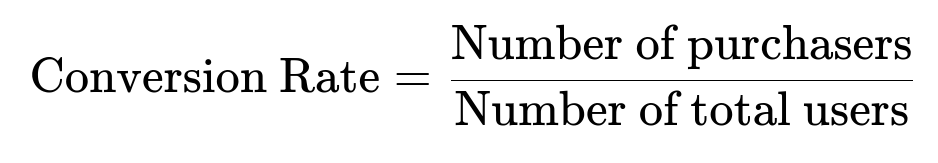
An essential metric here is the conversion rate. In plain text, the conversion_rate = (number_of_purchasers) / (total_users). Below is a core formula representation:
where:
Number of purchasers = count of distinct user_id entries in transactions.
Number of total users = total unique users in that group (interacting or non-interacting).
Once we have these rates for each group, we can determine if the group that performs likes/comments exhibits a higher conversion rate.
Example SQL Query
SELECT
    CASE WHEN e.user_id IS NOT NULL THEN 'Interacted' ELSE 'Did Not Interact' END AS interaction_group,
    COUNT(DISTINCT t.user_id) AS purchaser_count,
    COUNT(DISTINCT u.user_id) AS total_users,
    1.0 * COUNT(DISTINCT t.user_id) / COUNT(DISTINCT u.user_id) AS conversion_rate
FROM users u
LEFT JOIN (
    SELECT DISTINCT user_id
    FROM events
    WHERE action IN ('like', 'comment')
) e ON u.user_id = e.user_id
LEFT JOIN transactions t
ON u.user_id = t.user_id
GROUP BY
    CASE WHEN e.user_id IS NOT NULL THEN 'Interacted' ELSE 'Did Not Interact' END;
In this query:
The subquery
(SELECT DISTINCT user_id FROM events WHERE action IN ('like','comment')) eidentifies all users who have at least one "like" or "comment."A left join from
usersto that subquery tags each user as either having a user_id in that subquery (meaning they interacted) or not.Another left join to
transactionsdetermines if the user has made a purchase.We then group by the label
'Interacted'or'Did Not Interact'to see how many distinct users in each group actually purchased something (purchaser_count) out of the total number of distinct users in the same group (total_users).We compute the conversion_rate by taking the ratio of purchaser_count to total_users.
Interpreting the result involves comparing the conversion_rate across both groups. If the “Interacted” group has a significantly higher conversion_rate than the “Did Not Interact” group, it indicates that user engagement through likes or comments is associated with higher purchasing behavior.
Possible Follow-up Questions
How do you measure the statistical significance of any difference observed in the conversion rates?
A basic way to test the difference in conversion rates is a difference in proportions hypothesis test. If p1 represents the conversion rate for the interacting group, and p2 for the non-interacting group, we often use the following test statistic:

where:
p1 is the conversion rate of group 1 (e.g., Interacted).
p2 is the conversion rate of group 2 (e.g., Did Not Interact).
n1 is the total size (number of users) in group 1.
n2 is the total size (number of users) in group 2.
p is the pooled conversion rate = (total number of purchasers in both groups) / (total number of users in both groups).
Once we calculate the Z value, we can compare it against standard normal distribution thresholds (or compute a corresponding p-value). If the p-value is below a certain threshold (commonly 0.05), we conclude there is a statistically significant difference in conversion rates.
How might you account for differences in user behavior timing (e.g., user event happens after the transaction)?
One approach is to restrict your joins and aggregations to consistent time windows. For instance, you could:
Consider only events that happen within a certain period before the user’s first transaction.
Consider user cohorts who signed up within the same time frame to reduce biases due to differences in user lifetimes.
By carefully framing the time window, you ensure that the events (likes/comments) occurred before or during the purchase decision window.
What if a user has multiple transactions or multiple events?
Handling multiple entries is quite common. Depending on the analysis goal:
For the conversion metric (did the user ever purchase?), you only need to check if a user has at least one transaction.
For the interaction metric (did the user ever interact?), you only need to check if a user performed any like or comment event at least once.
In some advanced analyses, you might incorporate the total number of interactions or the sum of transaction amounts. However, for a simple “does engagement correlate with purchase or not,” just checking existence (at least one event, at least one transaction) is enough.
How do you handle potential confounding factors, like user demographics or marketing campaigns?
To get a clearer causal relationship, you might control for these factors by:
Segmenting the data by demographic variables (e.g., location, device type) to see if the pattern holds consistently across segments.
Including user acquisition source or marketing campaign data in the analysis. You can then compare conversion rates within each campaign or acquisition channel.
Using regression or propensity score matching techniques if you suspect that certain user segments are more prone to both interactions and purchases.
Such controls help ensure that the observed higher conversion rate is not merely coincidental with other factors that also influence purchasing.
Could you apply a machine learning approach to this problem?
You might use a classification model to predict the likelihood of a user making a purchase based on their website interactions, along with other features. For example:
import pandas as pd
from sklearn.model_selection import train_test_split
from sklearn.ensemble import RandomForestClassifier

# Suppose we have a dataset 'df' with columns:
# 'user_id', 'interacted' (boolean), 'other_feature', 'made_purchase' (boolean)
X = df[['interacted', 'other_feature']]
y = df['made_purchase']

X_train, X_test, y_train, y_test = train_test_split(X, y, test_size=0.2, random_state=42)

model = RandomForestClassifier(random_state=42)
model.fit(X_train, y_train)

predictions = model.predict(X_test)
Such models can incorporate many features (time spent on site, clicks, demographics) to confirm whether engaging with the website is a strong predictor of future purchasing.
How can you mitigate biases if interacting users inherently differ from non-interacting users?
It can be difficult to interpret correlation as causation, because perhaps more active users in general are also more likely to spend money. Methods such as:
Matching: Pair interacting users with similar non-interacting users based on shared attributes (e.g., user age, signup channel).
Pre-post analysis: Track each user’s purchase behavior before and after an interaction is performed.
These methods help isolate the effect of engagement from other user-level characteristics that might drive conversion.
Below are additional follow-up questions
What strategies would you use to handle missing or incomplete data in the events or transactions tables?
One common issue is that some users might appear in the users table without corresponding rows in events or transactions. This missing or incomplete data may lead to skewed conversion metrics if not handled properly. For example, some user interactions may not have been recorded if the event-logging system was down, or certain transaction records might be missing if the payment processor did not sync correctly.
Potential strategies:
Imputation or Exclusion: For missing events data, you could impute them as no events if you strongly believe the logging system is accurate except for occasional gaps. However, if data missingness is large or not random (e.g., certain user groups more likely to have incomplete logs), excluding or further investigating these users might be more reliable.
Cross-referencing Data Sources: Sometimes you can cross-check with alternative data sources (e.g., web server logs, partial offline transaction data) to fill in the gaps.
Sensitivity Analysis: Run multiple versions of your analysis under different assumptions about missing data (e.g., best-case scenario, worst-case scenario). If your conclusion (i.e., whether interactions drive higher conversion) remains robust, then missing data is less of a concern.
Mark as Unknown: Instead of simply labeling them as “Did Not Interact,” you might introduce a third category “Unknown Interaction,” separating them from truly “Did Not Interact” users.
Edge Cases and Pitfalls:
Biased Sample: If missing data is more prevalent in users who tend to purchase infrequently, your non-interacting group might artificially inflate or deflate the observed conversion rate.
Double Counting: If you attempt to “fix” missing data by cross-referencing multiple sources, ensure you do not double-count events or transactions.
How do you interpret conversion rates if the time window for measuring user actions and purchases varies greatly among different users?
It is often unclear whether a user who signed up recently and has had only a short observation period is truly a non-purchaser or simply hasn't had enough time to convert.
Considerations:
Fixed Observation Window: You can limit your dataset to users who signed up at least X days or weeks ago, giving them sufficient time to exhibit both interaction and transaction behaviors.
Censoring: If a user has not yet completed the typical “purchase lifecycle,” you could treat their purchasing behavior as “still being observed” rather than labeling them as a non-converter. This approach is often seen in survival analysis.
Cohort Analysis: Group users based on their signup month or quarter so each cohort has a similar “maturity” in your system. Compare conversion for cohorts that have the same length of time since signup.
Edge Cases and Pitfalls:
Seasonality: If users who joined during a holiday promotion or special event window behave differently, your results might be confounded.
Long Purchase Cycles: In certain industries with long consideration periods, you might need an even longer window to capture typical purchasing behavior.
Could the nature of interactions (e.g., number of comments, sentiment of comments) refine your analysis?
Sometimes, mere presence of an interaction (binary yes/no) might obscure patterns if the type or intensity of engagement is relevant. For instance, a user who posts numerous positive comments might convert differently from a user who leaves a single negative comment.
Detailed Approaches:
Interaction Intensity: Instead of just labeling a user as “Interacted,” you could track how many likes or comments they made. Then you can stratify or bin users based on low, medium, or high engagement.
Contextual Analysis: If you have text data for comments, you might classify them into positive, negative, or neutral sentiment categories. This helps you see whether positive or negative sentiment correlates differently with purchases.
Incremental Benefit: You might compare if multiple interactions further increase the chance of purchase or if a single interaction is enough to shift user behavior.
Edge Cases and Pitfalls:
Data Quality: Sentiment classification can be noisy if your algorithm is not well-tuned, leading to unreliable groupings.
Sparse Data: Many users might only have a single like or comment, making it challenging to form robust insights about different interaction levels if the sample size is small.
How would you handle users who start a purchase but never complete it, or who request refunds?
Purchases can be partially completed, abandoned, or even reversed. If you only count a completed transaction as a purchase, you might overlook partial conversions or returners.
Possible Strategies:
Include Payment Status: Track each transaction’s status (e.g., “initiated,” “completed,” “refunded”) and decide which statuses count toward the final conversion metric. Usually, only “completed” status is counted as a true purchase.
Separate Metrics: You might have a “purchase initiation rate” for those who start the checkout process versus a “purchase completion rate.” This can reveal if interacting users at least attempt to buy more often but might still cancel at higher or similar rates.
Net Purchases: Some businesses track net purchases (total purchases minus refunds), which can be used as a refined measure of actual monetary conversion.
Edge Cases and Pitfalls:
Negative Conversions: If refunds are frequent, you can encounter cases where some cohorts have more refunds than purchases, making net purchase calculations tricky.
Different Reasons for Cancellations: Some cancellations might be due to user dissatisfaction, payment failure, or purely external factors (like credit card issues). You need domain knowledge to interpret why certain user groups have more cancellations or refunds.
How do you address the possibility that spurious or bot-generated “likes” or “comments” inflate the interaction counts?
In real-world platforms, automated bots or malicious users can inflate engagement metrics, leading to incorrect assumptions about real user behavior and its correlation with purchases.
Mitigations:
Bot Detection: Filter out suspicious user_ids based on patterns such as extremely high frequency of events, repetitive text in comments, or known spam IP addresses.
Thresholding: If a single user posts thousands of likes or comments in an impossibly short time, mark them as outliers. This helps avoid skewing the data.
Multi-Factor Authentication: If each user undergoes a robust sign-up process, fewer bots make it through, so your data is more reliable.
Edge Cases and Pitfalls:
False Positives: Legitimately enthusiastic users could get flagged as bots if your rules are too strict.
Evolving Bot Behavior: Over time, bots might evolve to look more “human” in how they post, so continuous monitoring is necessary.
What would you do if you discover that marketing campaigns specifically target users who already tend to like or comment?
If the marketing team focuses advertisements or discounts on those who are more interactive, then any observed higher conversion might be partly or fully explained by targeted promotions rather than purely organic user interaction.
Approaches:
Control Groups: Identify subsets of the “Interacted” users who did not receive special promotions and compare their conversion rates to those who did receive promotions.
Regression Analysis: Include a feature for “was offered a promotion?” or “amount of discount received” in your model to isolate the effect of promotions from the effect of user engagement.
Propensity Score Matching: Match an “Interacted + Promoted” user to a “Did Not Interact + Promoted” user with similar user attributes to see if interaction still adds incremental benefit once promotions are accounted for.
Edge Cases and Pitfalls:
Overlapping Promotions: If a user gets multiple overlapping promotions, it can be difficult to attribute changes in behavior to a single campaign.
Untracked Promotions: Offline or word-of-mouth promotions may not be logged, introducing hidden variables in your analysis.
What if the volume of likes/comments heavily depends on the specific content viewed rather than the user’s personal preference?
Users might be more likely to comment on engaging or controversial content. The correlation you see between engagement and purchase may be confounded by content type. For example, if certain items or pages encourage discussion and also happen to be premium products, you might see a high correlation between “Interacted” and “Purchased,” but it may be the content’s nature, not simply user engagement.
Countermeasures:
Content-Level Analysis: Segment events by the type or category of content liked/commented on. Compare conversions among users engaging with purely “premium content” vs. more general content.
Randomized Content Exposure: If your platform randomly shows content to users, that can help disentangle whether the type of content drives both engagement and sales.
Interaction Normalization: Instead of counting raw number of likes/comments, you might consider the ratio of likes to the total content impressions for each user.
Edge Cases and Pitfalls:
Unequal Content Distribution: If a small portion of content accounts for most likes/comments, your sample for that content might be too narrow or specialized to generalize the findings.
Time Relevance: Certain content might be seasonal or time-sensitive, introducing confounding variables regarding user interest and subsequent purchases.
How would you handle real-time streaming data if you want to see immediate impacts of likes or comments on purchases?
A static or batch-based approach may not capture the rapidly changing patterns in some e-commerce or social platforms, especially when events and transactions can happen within minutes or seconds of each other.
Approaches:
Streaming Architecture: Use systems like Apache Kafka or AWS Kinesis to ingest events (likes/comments) and transactions in near real-time.
Windowing: In streaming analytics, define time windows (e.g., 1-hour, 24-hour intervals) to accumulate events and transactions for each user. Then compute rolling conversion rates.
Live Dashboard: Build real-time dashboards that show how many users engaged with the site in the last X minutes and how many made purchases subsequently.
Edge Cases and Pitfalls:
Duplicate or Late Arriving Data: In streaming scenarios, data for a single event might arrive late or out of order. You must handle event-time ordering to ensure accuracy in your real-time metrics.
Fault Tolerance: If streaming job failures occur, you might have partial data intervals that skew short-term conversion calculations.
How can sampling strategy influence the observed conversion rates?
If you’re not analyzing the entire population of users, but rather a sample, the choice of sampling method can affect the reliability and representativeness of your estimates.
Sampling Methods:
Simple Random Sampling: Randomly select users to form a smaller representative group. This helps maintain an unbiased estimate of overall conversion rates if done properly.
Stratified Sampling: If you suspect that certain user segments (e.g., by region, device type) behave differently, sample within each segment proportionally to avoid over/under-representation.
Oversampling Rare Groups: If users who interact are rare, you might oversample them in your dataset to get sufficiently large sample sizes for reliable analysis, then adjust the results using appropriate weights.
Edge Cases and Pitfalls:
Non-Response Bias: If certain subsets of users are excluded or less likely to show up in logs (e.g., ad-block users, incognito browsing), the final dataset may not be representative.
Volatility in Small Samples: If you are dealing with a small subset of users, random fluctuations can significantly change observed conversion rates from one sample to another.
In what scenarios might you prefer a more advanced causal inference technique over basic correlation analysis?
Basic correlation or straightforward grouping might show that “Interacted” users purchase at a higher rate, but establishing causality often requires more sophisticated methods.
When it’s Important:
Resource Allocation: If you plan to invest in features that encourage likes/comments, you want to be sure these interactions drive sales, not just correlate with them.
Observational Data: Without a controlled experiment (A/B test), you might rely on observational data. Tools like Instrumental Variables, Difference-in-Differences, or Regression Discontinuity can help isolate causality under certain conditions.
Complex User Journeys: In reality, users engage with multiple site features, promotional emails, and external factors. Causal inference frameworks help tease apart multiple treatments and confounding paths.
Edge Cases and Pitfalls:
Instrument Validity: If you use an instrumental variable approach, choosing the right instrument (correlated with engagement but not directly with purchasing) is tricky.
Parallel Trends Assumption: In a Difference-in-Differences framework, you need the assumption that interacting and non-interacting users would have had parallel purchasing trends in the absence of any interaction effect, which may not always hold.
Below are additional follow-up questions
How do you handle the distinction between user-level analysis and session-level analysis when examining the effect of interactions on purchases?
A key decision is whether to track behavior at the user level (e.g., aggregate all a user’s sessions) or the session level (each visit or login treated separately). User-level analysis examines if someone ever engaged and ever purchased. Session-level analysis pinpoints if a particular session’s engagement correlates with a purchase in that same session or a subsequent session.
Approaches and Considerations:
User-Level Aggregation: Summarize each user’s total or maximum engagement metric (e.g., total likes, number of comments) and total purchase amount or a binary purchase indicator (1 if purchased at least once, 0 if not). This approach is simpler to implement but can miss nuances about when the user engaged relative to when they purchased.
Session-Level Details: Tag each session with whether the user liked/commented or purchased during that session. This approach captures temporal ordering (engage first, then buy?), but can be more complex to analyze if session boundaries vary widely.
Hybrid: Combine both levels: session-level to observe immediate correlations and user-level to evaluate overall lifetime conversion.
Pitfalls and Edge Cases:
Multiple Accounts: One user might have multiple user accounts or come from different browsers, merging them incorrectly or missing them entirely can distort both user-level and session-level analyses.
Session Definition: Some platforms define a session with a 30-minute inactivity rule, while others rely on explicit login/logout events. Inconsistent session definitions can fragment or inflate observed session counts.
What challenges arise from multi-device usage, and how do you unify user identity across different devices or platforms?
Users often engage on desktop, mobile web, and mobile apps. If your system logs them as separate user_ids or anonymous cookies, you might undercount interactions or misattribute purchases.
Ways to Handle Identity Linking:
Login-Based Tracking: Encourage or require login so you can unify user activity across devices. This is the most reliable method but may cause friction if users don’t always log in.
Cross-Device Identifiers: If you have a robust user-identity graph from email addresses or phone numbers, you can unify events under a single user record.
Probabilistic Matching: Use fingerprinting (IP address, user agent, device ID) to guess whether different devices belong to the same user. This approach is less certain and can introduce errors.
Pitfalls and Edge Cases:
Household or Shared Device: A tablet might be used by multiple family members, conflating different real-world users into a single user_id.
Privacy Regulations: Strict data protection rules (GDPR, CCPA) might limit the collection or usage of cross-device identifiers.
How do you address changes over time in how “likes” or “comments” are defined or logged in your event system?
Platforms can evolve, altering how events are tagged, removing certain event actions, or introducing new ones. For instance, “comment” might be re-labeled as “post” or “reply,” or the logging schema might separate “likes” from “reactions.”
Strategies:
Versioning Schemas: Maintain a record of event schema changes with timestamps. When analyzing historical data, align events to their relevant definitions for that period.
Backfilling or Normalizing: If feasible, transform older events to the new schema or vice versa so that “comment” from older logs is equivalent to “reply” in current logs.
Separate Analysis Periods: If definitions have drastically changed, you might split the timeline and analyze each era’s data independently to avoid mixing incompatible definitions.
Pitfalls and Edge Cases:
Legacy Data Loss: If older logs were permanently deleted or overwritten, you might have an incomplete picture of historical user behavior.
Partial Adoption: Some users might still be using older app versions that log events differently while others use the new version, complicating direct comparisons.
How do significant external business changes, such as acquisitions or new product lines, impact your analysis?
Large-scale external factors can radically shift user behavior. For example, an acquisition might bring in a new user base from a different platform, while new product lines may attract different demographics.
Analysis Implications:
Segment by Major Milestones: Mark key dates (e.g., acquisition completion, product launch) and compare user engagement and purchase rates before and after. This reveals if the fundamental relationship between engagement and conversion changed.
Data Integration: Merging data from two distinct platforms might require reconciling different user_id systems, event definitions, or transaction logging methods.
Cohort Realignment: If new features lead to different user flows, you may need to treat those user cohorts separately since their path from interaction to purchase may no longer be comparable to the old user journey.
Pitfalls and Edge Cases:
Short Overlap Windows: If the transition is abrupt, the overlap period for comparing old vs. new user behavior might be very small, risking unreliable conclusions.
User Behavioral Shifts: Existing users might drastically change their behavior due to new offerings, so it’s not just new user cohorts that differ—older cohorts might also adapt.
What approach would you take to incorporate repeated or longitudinal purchases into measuring conversion, rather than a one-time purchase metric?
A user can make multiple purchases over their lifetime, and their engagement patterns may vary in between purchases. Relying on a simple “did they ever purchase” measure might miss important repeat purchase behavior.
Advanced Considerations:
Recency-Frequency-Monetary (RFM) Model: Track the time since last purchase (recency), how often a user purchases (frequency), and how much they spend (monetary) to see how engagement correlates with each dimension.
Lifetime Value (LTV): Instead of a binary purchase metric, examine total or average revenue per user over a period, correlated with likes/comments.
Time Series Analysis: Use repeated measures to observe how interactions before each purchase relate to that purchase. This can be more complex but provides granular insights into ongoing user behavior.
Pitfalls and Edge Cases:
Clumpy Purchases: Users might make numerous purchases in a short burst then go dormant, or vice versa, complicating a standard conversion funnel model.
Differing Purchase Cycles: Some products have short purchase cycles (e.g., daily coffee) while others (e.g., electronics) might be annual. Blanket definitions of “frequent purchase” could misrepresent behavior across categories.
How can you investigate and adjust for lead-lag relationships where likes/comments might occur after a user has already decided to purchase?
Sometimes a user’s decision to purchase could occur before they engage socially. They might comment about wanting a product only after they’ve already placed the order. That reversed sequence complicates the idea that engagement drives conversion.
Investigation Steps:
Temporal Ordering: Use timestamps to see if the user’s first purchase actually occurs before they start liking or commenting. If so, that user’s interaction is unlikely to have caused the purchase.
Lag Windows: Define a time window between engagement and purchase (e.g., 7 days prior to purchase). Only count interactions within that window as relevant for influencing the purchase.
Causal Path Analysis: If your hypothesis is that likes/comments lead to purchase, you must isolate user interactions that definitively happen before the purchase event.
Pitfalls and Edge Cases:
Simultaneous Events: Some logging systems might record events in the same timestamp or out of order due to system latency, blurring the actual sequence.
Multiple Purchases: A user might interact before the second purchase but not before the first, so your analysis must handle repeated events carefully.
How can user feedback or surveys about their motivations behind liking or commenting help in interpreting purchase behaviors?
A like or comment might indicate social approval, curiosity, or even a negative viewpoint. Surveys or user research can give additional context to these interactions, clarifying whether they reflect genuine interest in a product or are unrelated.
Methods:
Post-Engagement Surveys: Prompt users with a brief question (e.g., “Why did you comment on this product?”). Their responses can reveal if the comment was indicative of purchase intent or just casual feedback.
Qualitative Interviews: Conduct in-depth interviews with a subset of users to better understand how their online engagement correlates with shopping habits.
Hybrid Data: Correlate the textual or sentiment analysis of comments with self-reported motivations, providing more accurate labeling for training or validation.
Pitfalls and Edge Cases:
Sampling Bias: Only highly motivated users might respond to surveys, leading to an unrepresentative picture of overall user motivations.
User Fatigue: Overly frequent survey prompts can annoy users, causing them to exit or provide low-quality answers.
How might you set up a controlled experiment to test the impact of increased user interaction on purchases?
Correlational data is always subject to confounding. A direct experiment would manipulate the likelihood that a user interacts (e.g., by showing them features encouraging liking/commenting) to see if it elevates conversion.
Experiment Design:
Random Assignment: Randomly select a portion of users (treatment group) and give them an interface or incentive that encourages more likes/comments (e.g., highlight “Like” buttons, display comment prompts). The control group sees the standard interface.
Measure Conversion: Track if the treatment group’s purchase rate significantly differs from the control group.
Split Testing Tools: Implement A/B testing frameworks (e.g., Optimizely, Google Optimize) or a homegrown experiment platform to ensure randomization and consistent user experiences.
Pitfalls and Edge Cases:
Unintended Side Effects: The new interface might also alter user navigation patterns or distract them, confounding results.
Spillover Effects: If users in the treatment group interact with users in the control group (e.g., commenting on shared content), the control group might be indirectly influenced, diluting the experiment’s isolation.
How do you connect the observed relationship between engagement and conversion with long-term user retention or lifetime value?
Even if a user is more likely to purchase once after interacting, the real question may be whether they stay engaged long term and continue purchasing. A one-time uplift in purchases might not translate to sustained value.
Approaches:
Cohort Retention Curves: Track each cohort’s retention over weeks or months, segmenting by interaction status. See if the “Interacted” cohort not only buys more initially but also remains active longer.
Lifetime Value (LTV): Model user LTV by estimating revenue over a user’s entire tenure, factoring in churn rates. This can help ascertain if interactive users consistently drive more revenue.
Churn vs. Engagement: Investigate whether higher engagement leads to lower churn probability. If so, these users might continue purchasing beyond a one-time event.
Pitfalls and Edge Cases:
Delayed Churn: Users might appear engaged early on but abruptly stop after a short period, making initial interactions seem more influential than they really are.
Channel Interactions: If a user interacts frequently on one channel (e.g., mobile app) but purchases only on desktop, you need cross-channel data to accurately attribute retention and conversions.