
ML Interview Q Series: What are the major distinctions between Hierarchical Clustering and k-Means Clustering?

📚 Browse the full ML Interview series here.
Comprehensive Explanation
Hierarchical Clustering and k-Means Clustering are two popular unsupervised learning techniques used for grouping data points based on similarity. Although they aim for the same goal—clustering—their approaches, underlying assumptions, computational complexities, and interpretability differ in important ways.
Conceptual Overview
Hierarchical clustering does not need a predefined number of clusters. It operates by either merging smaller clusters step by step (agglomerative approach) or splitting larger clusters step by step (divisive approach). The entire process can be visualized in a dendrogram, a tree-like structure that shows how clusters are formed at each distance threshold.
k-Means clustering, in contrast, requires the user to specify the number of clusters k beforehand. It tries to assign each point to the nearest cluster centroid in an iterative manner, continually refining centroid positions until a convergence criterion is met.
Objective in k-Means Clustering
One of the most central aspects of k-Means is its objective function, which is the sum of the squared Euclidean distances between each point and its assigned cluster centroid. This objective is often referred to as the within-cluster sum of squares:
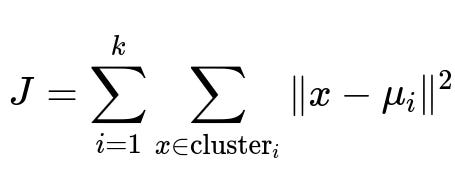
Where x is a data point, mu_i is the centroid of the i-th cluster, and k is the total number of clusters. The algorithm iterates between assigning data points to the nearest centroid and recalculating the centroid locations to minimize this sum of squared distances.
Detailed Explanation of Each Parameter in the Formula
J is the total within-cluster sum of squares that k-Means aims to minimize. k is the predefined number of clusters. x represents any data point that is being clustered. mu_i is the centroid (mean position) of cluster i, computed by averaging all the points currently assigned to that cluster. The double summation indicates that we sum over all clusters i (from 1 to k) and, within each cluster i, we sum over all data points x that belong to that cluster.
Initialization and Sensitivity
Hierarchical clustering does not rely on initial guesses of where clusters should form. Instead, the merging or splitting of clusters is guided by a distance metric (such as Euclidean distance, Manhattan distance, or any other measure). As a result, there is no separate “seed” or “initial centroid” problem in hierarchical clustering.
k-Means, however, heavily depends on the initial choice of centroids. Poorly chosen initial centroids can lead to suboptimal results. Techniques like k-Means++ are used to mitigate sensitivity to initialization by choosing initial centroids that are well-dispersed.
Number of Clusters
Hierarchical clustering constructs a complete hierarchy of possible clusters. The number of clusters is found by “cutting” the dendrogram at a specific level. This makes it flexible but can also require careful inspection of the dendrogram to decide on the optimal number of clusters.
k-Means requires specifying k beforehand. This is both an advantage (if you know how many clusters you expect) and a disadvantage (if you have no prior knowledge). Methods like the elbow method or the silhouette coefficient can help in choosing an appropriate k.
Cluster Shapes and Assumptions
Hierarchical clustering can adapt to various cluster shapes depending on the linkage criteria chosen (single-linkage, complete-linkage, average-linkage, etc.). It doesn’t assume clusters are spherical or convex.
k-Means, by its nature, is inclined to produce convex, roughly spherical clusters in Euclidean space. This can be a limitation for datasets where clusters are not well-separated by spherical boundaries.
Computational Complexity
Hierarchical clustering typically has higher computational cost, especially in its naive form, because it involves calculating and updating the distance matrix between points (or clusters) at every merge or split step. The computational complexity can be on the order of n^3 for standard implementations, although optimized variants exist.
k-Means usually scales better for large datasets. The standard k-Means approach has complexity often approximated by O(n * k * d * T), where n is the number of points, k is the number of clusters, d is the dimensionality of the data, and T is the number of iterations until convergence.
Interpretability and Practical Considerations
Hierarchical clustering is highly interpretable because the dendrogram shows the hierarchical relationships among data points at different distance thresholds. This makes it easier to visually inspect and decide how many clusters best represent the data.
k-Means can be easier to implement and run quickly on large datasets. Its result is less intuitive to interpret in terms of a hierarchy, but it provides clear cluster centroids that can be examined and labeled if necessary.
How to Decide Which to Use
When the dataset is relatively small or when interpretability (via dendrogram) is crucial, hierarchical clustering is often a good choice. It is also useful when you do not have a clear idea of how many clusters there should be. If you have a large dataset and you know (or can estimate) the number of clusters, k-Means is typically more efficient and easier to deploy at scale.
Follow-up Questions
What are some ways to determine the optimal number of clusters in hierarchical clustering?
One approach is to visually inspect the dendrogram and decide where to “cut” the tree based on distances or structural changes. Another systematic method is to use internal evaluation metrics like the silhouette coefficient, which indicates how well-separated the clusters are. There is also the inconsistency method, which compares the distance at each node to the average distance of its constituent nodes at lower levels in the dendrogram.
How do we choose the distance metric in hierarchical clustering?
The distance metric in hierarchical clustering depends on the nature of the data and domain knowledge. Common metrics include Euclidean distance, Manhattan distance, or correlation-based distances. The choice of linkage (single, complete, average, Ward’s) also influences how cluster distances are computed. The “best” choice can vary by dataset. For example, Ward’s linkage is somewhat similar in spirit to k-Means since it tries to minimize the within-cluster variance when merging.
Is k-Means suitable for clusters with non-spherical shapes or varying densities?
k-Means can struggle with clusters that are elongated, non-spherical, or have varying densities. Because it uses Euclidean distance to assign points to the nearest centroid, data that forms curved or elongated shapes may be poorly segmented by k-Means. If the data is known to have complex cluster shapes or non-uniform densities, methods like DBSCAN, Mean Shift, or spectral clustering might be more effective.
How do outliers affect hierarchical clustering compared to k-Means?
k-Means is sensitive to outliers because large distances can skew the centroid calculations. Outliers can pull the centroid toward themselves, degrading cluster quality. Hierarchical clustering is generally more robust to outliers when using certain linkage criteria, though extreme values can still affect how distances between clusters are computed. In agglomerative clustering, outliers may appear as singleton clusters that only merge with the rest at large distance thresholds.
How do we handle large-scale datasets with hierarchical clustering, given its high computational cost?
For large datasets, hierarchical clustering can become very costly if implemented naively. Approximate or hybrid methods (e.g., “mini-batch” hierarchical clustering, or running a faster clustering method first to reduce the data size) can help. Some libraries use efficient data structures (like KD-trees or ball trees) to speed up nearest neighbor queries. Another strategy is to use k-Means to create initial sub-clusters, then apply hierarchical clustering on the centroids of those sub-clusters to combine them at higher levels of granularity.