
ML Interview Q Series: What insights can be derived from multi-select political survey data where respondents can choose multiple candidates?

📚 Browse the full ML Interview series here.
Comprehensive Explanation
Analyzing multi-select responses in a political survey means you are working with a scenario in which respondents can simultaneously indicate support or interest in multiple candidates. This type of data offers a distinctive perspective on voter overlap, candidate complementarity, and potential coalitions. The key is to investigate not only how many people favor each candidate individually, but also the degree to which they are favored in combination with others.
You can examine how frequently pairs or sets of candidates get selected together, revealing where voter bases overlap. This might highlight groups of candidates who share a similar demographic appeal. Additionally, you can discover unique segments of the population that exclusively support a single candidate or a particular group of candidates. By studying response patterns, you can recommend campaign strategies to broaden support or target the most receptive demographic segments.
Another valuable aspect is the ability to analyze partial or conditional preferences. If someone supports both Candidate A and Candidate B, you can investigate what distinguishes them from those who support only Candidate A or only Candidate B. Furthermore, you could attempt to predict how certain demographic factors (age, income, education) correlate with multi-candidate selections.
Overlapping Support Among Candidates
One straightforward way to quantify how frequently two candidates appear together in respondents’ selections is to calculate the fraction of participants who selected both candidates out of those who selected at least one of them. This is often measured with a Jaccard similarity coefficient, which is useful for multi-set analyses because it focuses on the union and intersection of sets.
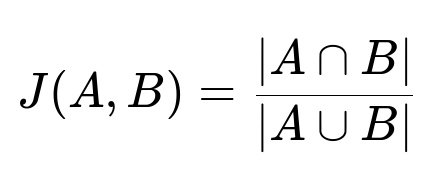
Where A is the set of survey participants who selected Candidate A, B is the set of survey participants who selected Candidate B, A intersect B is those who picked both Candidate A and Candidate B, and A union B is those who picked at least one of Candidate A or Candidate B. This value ranges from 0 (no overlap) to 1 (complete overlap).
When you compute this measure for every pair of candidates, you can create a matrix of overlap scores, helping you visualize which candidates frequently appear together in respondents’ selections.
Association Rule Mining
For a more advanced approach, you can apply association rule mining (commonly known from market basket analysis) to identify stronger or weaker relationships among candidate selections. For example, you could look at how often people who choose one candidate also choose another, providing deeper insight into potential alliances or voter migration patterns.
Handling and Cleaning Multi-Select Data
Multi-select data often arrive in a format where each respondent’s choices might be represented by a series of binary flags (one flag per candidate: 1 if selected, 0 if not). Ensuring that this data is properly cleaned (no impossible values, no contradictory responses) is crucial. Often, you need to deal with partial responses or large amounts of missing data if participants skipped questions or ended the survey prematurely.
Example of Processing Multi-Select Data in Python
import pandas as pd

# Suppose we have a DataFrame 'df' with columns for each candidate (e.g., 'candA', 'candB', 'candC')
# Each entry is 1 if the respondent selected that candidate, and 0 otherwise.

# Calculate the percentage of respondents who selected each candidate
candidate_cols = ['candA', 'candB', 'candC']
selection_rates = df[candidate_cols].mean() * 100

# Calculate pairwise overlaps using simple intersection over union approach
import itertools

pairwise_jaccard = {}
for c1, c2 in itertools.combinations(candidate_cols, 2):
    intersection = ((df[c1] == 1) & (df[c2] == 1)).sum()
    union = ((df[c1] == 1) | (df[c2] == 1)).sum()
    jaccard_similarity = intersection / union if union != 0 else 0
    pairwise_jaccard[(c1, c2)] = jaccard_similarity

print("Selection rates (%) per candidate:\n", selection_rates)
print("\nPairwise Jaccard similarities:\n", pairwise_jaccard)
This snippet demonstrates how to compute simple descriptive statistics for multi-select data. You first calculate how often each candidate was selected, then look at pairwise overlaps as a measure of the fraction of respondents who selected both compared to those who selected at least one.
Potential Pitfalls
Dealing with multi-select data poses potential risks such as respondents selecting many candidates just because they feel neutral or mild support for multiple individuals. This behavior can inflate overlap counts. Additionally, if a respondent consistently chooses a large set of candidates, it may skew the results, making it seem as though every candidate has shared support with that respondent’s picks. To mitigate this, you could filter respondents based on how many candidates they select in total or weigh selections by some measure of preference intensity.
How can you measure the overlap between candidates if the data is imbalanced?
If you suspect one candidate’s support is far larger than another’s, a direct percentage of overlap can be misleading. You can normalize your calculations by candidate size or use metrics like the Jaccard coefficient shown earlier. Another approach is to compute conditional probabilities, such as the probability of choosing Candidate B given you have chosen Candidate A, to capture directionality in the relationships.
When the data are highly imbalanced (some candidates have very few supporters), you can stratify the sample or apply weighting schemes. This helps ensure that the minimal support for one candidate does not get overshadowed or artificially exaggerated when combined with a very popular candidate’s supporters.
How do you address respondents who select almost all candidates?
One common reason participants might select most or all candidates is that they have not formed strong opinions, or they are open to many choices. While these responses are valid, they might still distort patterns of shared support. You could remove or down-weight participants who pick a large fraction of candidates, or you could do additional surveys to gauge preference strength. Alternatively, you can calculate more nuanced metrics (like partial preference scores) rather than treating every selection as equal.
Could you use clustering on multi-select data?
Yes. By treating each respondent’s multi-select choices as a vector of binary features (one dimension per candidate), you can cluster respondents to find groups that share common selection patterns. Techniques like hierarchical clustering or k-means (though k-means can be less ideal for binary data) can group respondents based on candidate choices. This can be extremely helpful for marketing campaign messages, as each cluster often represents a distinct type of voter base, guiding targeted messaging strategies.
Is there a risk of multicollinearity or correlation issues in predictive modeling?
When modeling an outcome (for instance, whether someone will donate to the campaign) using multi-select variables, you may face correlation problems. Several candidates can have overlapping supporters, which can create redundant predictors. Regularization methods (like Lasso or Ridge) or dimension reduction techniques (like PCA) can help mitigate these issues by penalizing or combining highly correlated features. In practice, you need to confirm that each variable you include in the model contributes unique information, rather than just replicating signals already captured by the other variables.
Below are additional follow-up questions
What if the number of possible candidates is extremely large and creates dimensionality challenges?
When there are many candidates on a ballot, the multi-select data for each respondent could span hundreds of possible columns (one for each candidate). This high-dimensional data can make computation and analysis more difficult. In such a scenario, some of the key concerns include:
Sparse Selections If the majority of respondents pick just a few candidates out of a large set, the data becomes highly sparse. Many rows may contain mostly zeros, which can complicate clustering, correlation analysis, and predictive modeling.
Computational Complexity Calculating pairwise overlaps or similarity measures for every pair of candidates can become infeasible when the candidate set is extremely large. For instance, a naive computation of all pairwise intersections might require iterating over a matrix with dimensions in the tens or hundreds of thousands, which is computationally expensive.
Dimensionality Reduction Techniques like Principal Component Analysis (PCA) are less suited for purely binary data if the data is extremely sparse. Alternative methods, such as non-negative matrix factorization (NMF) or specialized algorithms for large-scale binary data, might be more appropriate to capture patterns in a more compressed, lower-dimensional space.
Potential Solution You can implement thresholding to reduce dimensionality by focusing on candidates with a minimum level of support. If some candidates receive extremely few selections, you could exclude them from deeper analyses. Alternatively, you can group similar or lesser-known candidates together if it makes sense politically and contextually (for example, minor party candidates).
How can partial or item non-response be handled in multi-select data?
In real surveys, some respondents may skip certain questions or leave them partially filled. For multi-select questions, this might mean you only know some of their chosen candidates while others are blank. Key considerations include:
Data Imputation Imputation can be tricky for binary multi-select data. Standard numerical imputation techniques (e.g., replacing missing values with means or medians) do not directly translate well to categorical/binary situations. You might resort to specialized imputation strategies that consider the correlation structure among selected candidates.
Exclude vs. Include You could exclude partial responses entirely, but that might lead to significant data loss and bias if non-response patterns are systematic (e.g., younger voters might skip more questions). A more nuanced strategy involves retaining partially completed data but carefully marking missing values as “unknown.”
Weighting Schemes One approach is to assign different weights based on the percentage of completion. This can preserve the responses that are already provided while discounting the uncertainty caused by missing selections.
Sensitivity Analysis When you decide on an imputation or exclusion strategy, conduct a sensitivity analysis. Compare results with different imputation assumptions (for example, treat missing responses as zeros vs. treating them as truly unknown), and see if the main conclusions hold.
What if you have multiple waves of surveys over time and want to track how multi-select preferences evolve?
When a campaign runs multiple surveys across different phases (e.g., pre-primary, post-debate, final run-up to election day), you can track how respondents’ multi-select preferences shift over time. Potential analyses include:
Time-Series Analysis Identify trends. If a candidate is consistently being co-selected alongside another candidate, see if that changes across survey waves. This helps you understand the dynamic nature of voter overlap.
Cohort Tracking Track the same group of respondents across waves to see how their choices evolve. Some individuals might narrow their picks over time or switch from supporting multiple candidates to focusing on one.
Impact of Events Major events—like a debate or a policy announcement—could cause a sudden change in multi-select patterns. By comparing data from before and after these events, you can assess how external factors shape candidate co-selections.
Attrition and Missingness Repeated surveys introduce new challenges, such as respondent dropout. This attrition may systematically bias the data if certain voters (e.g., those disenchanted with politics) stop responding, thus skewing the results toward more politically engaged participants.
Could multi-select data be used to forecast likely vote splits or run-offs in a real election scenario?
Turning multi-select data into a direct forecast of election results is tricky, because selecting multiple candidates in a survey does not necessarily translate into actual voting behavior. Important considerations include:
Preference Strength Multi-select data only tells you that someone is considering or is open to a candidate. It does not measure how strongly they support each candidate or their ultimate choice under a one-person, one-vote system. Additional data—like preference ranking or rating scales—might be needed.
Behavioral Models You could attempt to model the probability of eventually voting for each candidate, given a respondent’s multi-select picks and other attributes. Logistic regression or probabilistic models could be used, but the training data must contain final vote outcomes or some ground-truth measure.
Contextual Factors The presence of strategic voting, the format of the election (e.g., single-round vs. runoff system), and the availability of candidate endorsements can drastically influence how multi-select preferences convert into an actual vote. Poll aggregation methods may need to incorporate weighting factors for known behavioral patterns (e.g., lesser-known candidates see a large drop in actual votes compared to poll interest).
How should the campaign interpret multi-select data in contexts with differing cultural or regional norms?
Cultural factors can strongly influence how people respond to multi-select questions. In some regions, voters might be accustomed to a single-choice environment and thus rarely select multiple candidates, even if allowed. In other cultures, people might readily show support for multiple candidates. This variability can cause:
Bias in Selection Patterns Respondents from certain backgrounds may consistently under-report multiple support because they are used to focusing on one “primary” candidate. Conversely, others might over-select due to a tendency to express general approval.
Differentiation Strategies In a setting where multi-select is common, a campaign must craft messages that capture the distinctive reasons to prioritize one candidate over others. If the cultural norm is to be open-minded about multiple candidates, your data might show many overlaps, which can complicate attempts to differentiate your candidate.
Segmentation Adjustments It may be wise to segment respondents by geography or culture, then analyze multi-select patterns separately to avoid conflating very different selection behaviors within a single aggregate data set.
Is it possible that some minor or fringe candidates influence the perceived overlaps of major candidates?
Yes, when the set of options includes many lesser-known or fringe candidates, the overlap metrics may shift for major contenders. For instance:
Artificially Elevated Overlaps If a fraction of the population selects nearly all minor candidates to show protest or broad interest, you might see inflated overlap among the popular candidates when combined with these picks. This can hide genuine differences among major candidates’ base support.
Filtering Out Low-Incidence Selections You could choose to eliminate candidates below a certain threshold of popularity from analyses of overlap among major candidates. However, doing so can cause you to lose the nuance of small but dedicated supporter bases.
Coalition-Building Insight At times, a minor candidate might share a large overlap with a single major candidate, signaling the potential for that major candidate to gain more support if the minor candidate exits or endorses them. This can be important for understanding coalition-building dynamics in multi-candidate fields.
Should the campaign apply weighting or thresholds for analyzing multi-select if certain candidates are not serious contenders?
Campaigns often face data where some candidates are effectively not viable. This raises the question of whether to weight or ignore those candidates in deeper analysis. Consider:
Practical Focus If your end goal is to strengthen your candidate’s position, ignoring non-serious contenders might make sense for high-level strategy. It can simplify your data and help you focus on the realistic major contenders.
Risk of Missing Dynamics Even a candidate with minimal support can have local or niche impact, which might matter in certain districts or among certain demographic groups. Overlooking such candidates might lead you to miss critical insights about specific voter subgroups.
Adaptive Thresholding A data-driven approach might be to set a dynamic threshold—e.g., only include candidates with at least 5% overall selection in the last wave of the survey. This ensures you are capturing significant players without adding undue noise. However, if a candidate’s support is surging, you might only discover this if you periodically recheck their inclusion status.
How do you protect respondent anonymity and handle potential privacy risks in multi-select data?
Multi-select data about political preferences is sensitive. Protecting respondent anonymity is a legal and ethical necessity. Issues to consider:
Granular Identification Risk In small regions or highly segmented demographic groups, a combination of multi-select choices could be unique enough to re-identify a respondent, especially when combined with other personal attributes like age, ZIP code, or income.
Data Anonymization Techniques like k-anonymity, l-diversity, or differential privacy can reduce the likelihood of re-identification. For instance, you might only release aggregated statistics (overlap counts, rates of support) rather than raw, respondent-level multi-select data.
Secure Storage and Access Limit access to raw data to only essential personnel within a secure environment. Logs of data usage and robust encryption can further protect sensitive survey responses.
Consent and Transparency Always ensure respondents are informed about how their data will be used and have provided explicit consent. If you plan to analyze or share multi-select data, clarify that these questions can reveal nuanced political leanings. This builds trust and ensures ethical data handling.