
ML Interview Q Series: What is one limitation of the R-squared metric, and how could it be handled or resolved?


📚 Browse the full ML Interview series here.
Comprehensive Explanation
R-squared is widely used to measure the proportion of variance in the dependent variable that is predictable from the independent variables. A key point to recall is that R-squared alone does not penalize models for adding more parameters, even if those parameters provide minimal or no improvement in predictive power. In other words, R-squared always goes up (or at least stays the same) when more predictors are included in a linear model, regardless of whether those predictors are significant or add any real explanatory value.
One of the most common ways to express R-squared is:
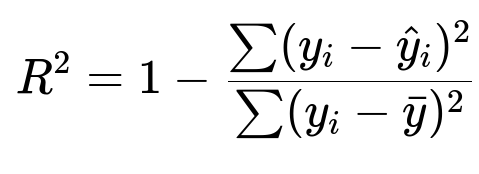
Here:
y_i is the actual target value for the i-th data point in the dataset.
hat{y}_i is the predicted target value from the model for the i-th data point.
bar{y} is the mean of the actual target values in the dataset.
The numerator sum(y_i - hat{y}_i)^2 is often called the residual sum of squares (SSR), and the denominator sum(y_i - bar{y})^2 is the total sum of squares (SST).
Although R-squared is a convenient measure to see how well the model explains the overall variability of the response variable, here is a primary disadvantage: it does not control for the number of features in the model. If a model includes many predictors, R-squared can become artificially inflated, giving the misleading impression that the model has strong explanatory power.
To address this, one can: • Use Adjusted R-squared, which introduces a penalty for additional predictors. • Employ cross-validation techniques and metrics like RMSE or MAE on validation/test sets to verify whether more features lead to genuine improvements rather than just overfitting. • Explore information criteria (AIC or BIC), which also penalize model complexity and can indicate whether the added parameters truly improve the model fit in a generalizable manner.
An example in Python to illustrate how you might incorporate adjusted R-squared in your workflow with scikit-learn:
import numpy as np
from sklearn.linear_model import LinearRegression
from sklearn.metrics import r2_score

# Suppose X is your feature matrix and y is your target vector
model = LinearRegression()
model.fit(X, y)
predictions = model.predict(X)

r2 = r2_score(y, predictions)
n = X.shape[0]  # number of samples
p = X.shape[1]  # number of predictors

# Calculate adjusted R-squared
adjusted_r2 = 1 - (1 - r2)*(n - 1)/(n - p - 1)

print("R-squared:", r2)
print("Adjusted R-squared:", adjusted_r2)
In this snippet, n is the number of samples in the dataset, and p is the number of predictors. The adjusted R-squared penalizes the R-squared value as more predictors are added, correcting for the possibility of artificially inflated performance.
What are other limitations of R-squared, and how do we interpret them?
R-squared does not necessarily indicate how well the model will predict unseen data. Two models can produce the same R-squared on training data but have vastly different predictive performance on out-of-sample data. Hence, it is critical to complement R-squared with proper validation strategies (like k-fold cross-validation) and other error metrics.
Another subtlety is that R-squared can be low in perfectly valid models where the data is inherently noisy or the underlying relationships are more complex or non-linear. It does not measure how far off the predictions are in absolute terms—something that metrics like RMSE or MAE address more directly.
How do we decide between R-squared and Adjusted R-squared?
When working with a large number of features, it is generally advisable to use the adjusted R-squared. This metric can be especially helpful if you want to do feature selection or if you suspect that your model might be overfitting to the training data by including too many variables. For smaller feature sets or initial explorations, regular R-squared can give a quick snapshot of how well the model is capturing variance, but one should always keep the model complexity in mind.
Is there a scenario where R-squared can be negative?
Yes, R-squared can be negative if the chosen model does worse than a simple horizontal line predictor that always predicts the mean bar{y}. This often happens in cases of severe underfitting or if an inappropriate model class is used for the dataset’s underlying patterns. It indicates that the sum of squares of the residuals is even larger than the total sum of squares around the mean, signifying a model that is quite poor at capturing the data’s structure.
Could we use R-squared for non-linear or non-parametric models?
While R-squared is typically introduced in the context of linear regression, it can be computed for various types of regression tasks, including non-linear or non-parametric methods, as long as there is a meaningful notion of predicted vs. actual outcomes. However, you should check whether R-squared remains a good measure in your specific setting because certain model classes might have behaviors that cause R-squared to be less interpretable. In such scenarios, more robust error metrics or domain-specific evaluation might be better.
When do we prefer alternative measures like MAE or RMSE over R-squared?
If your priority is to understand how large the errors are in original units of the output variable, metrics like MAE and RMSE directly quantify the magnitude of error. In applications where being off by a certain numerical amount can be critical (for instance, predicting prices or medical dosages), an error-based metric is more actionable. R-squared alone cannot tell you if predictions are off by an amount that is practically significant, it only shows the proportion of explained variance.
Why might cross-validation be essential despite a high R-squared or Adjusted R-squared?
Even if R-squared or adjusted R-squared is high on the training set, the true test of a model is how well it generalizes to new, unseen data. Cross-validation ensures that you do not get deceived by an artificially inflated R-squared due to overfitting. By splitting the data into multiple folds and training/testing on these folds, you get a more robust assessment of out-of-sample performance.
Overall, while R-squared can be a quick reference to judge model fit, relying solely on it can be misleading if the model is unnecessarily complex or not validated properly. Adjusted R-squared, cross-validation, and supplementary metrics address these pitfalls to build models that generalize well in real-world scenarios.