
ML Interview Q Series: What is the Gini Index, and in what manner is it applied within Decision Tree algorithms?

📚 Browse the full ML Interview series here.
Comprehensive Explanation
The Gini Index is a metric that measures how frequently any chosen element from a dataset would be incorrectly identified if it were randomly labeled, based on the distribution of class probabilities. It is commonly used in classification Decision Trees to evaluate potential splits on features.
To compute the Gini Index for a dataset D containing C classes, you sum over each class the product of its probability and one minus that probability. The formula can be written as
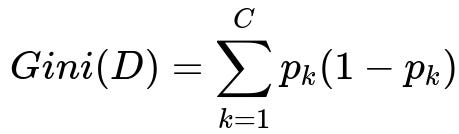
Here, C is the total number of classes, and p_k is the fraction of elements in D belonging to class k. Specifically, p_k is the number of items in class k divided by the total number of items in D. The expression p_k (1 - p_k) measures the impurity contribution of class k, and summing this over all classes gives the Gini impurity for the set D.
A value closer to 0 indicates that D is predominantly composed of one class (hence lower impurity), whereas values approaching their maximum indicate more equal proportions among classes (hence higher impurity). When building a Decision Tree using the Gini criterion, the algorithm looks at each candidate feature (and possible split points for that feature) to see which split would yield the largest decrease in Gini impurity. It chooses that best split, partitions the data accordingly, and then recursively applies the same procedure to the resulting subsets until reaching some stopping criterion (such as maximum depth or minimum samples in a leaf).
In a Decision Tree, you often compute an overall “impurity reduction” or “information gain” for a candidate split by subtracting the weighted Gini impurity of each resulting child node from the original node’s Gini. This “best” split is the one that yields the greatest reduction in impurity.
A brief example in Python to illustrate how one might calculate the Gini for a dataset with two classes is shown below.
def gini_index(labels):
    from collections import Counter
    total_count = len(labels)
    if total_count == 0:
        return 0
    class_counts = Counter(labels)
    gini = 1
    for cls in class_counts:
        p_cls = class_counts[cls] / total_count
        gini -= p_cls**2
    return gini

# Example usage:
sample_labels = ['cat', 'cat', 'dog', 'cat', 'dog']
print(gini_index(sample_labels))
In this snippet, we have a simple approach to compute the Gini Index by subtracting the sum of squared probabilities from 1. If the dataset is heavily dominated by one class, the Gini will be close to 0, indicating relatively pure data.
Why Gini Index Matters
The Gini Index is popular in classification tasks because it is computationally efficient and easy to interpret. It correlates well with the objective of improving classification purity at each split. Although other criteria, such as entropy, can also be used, Gini often provides a very similar split and is slightly faster to compute because it avoids the use of logarithms.
What Happens When Classes Are Imbalanced
In cases of imbalanced classes, the Gini Index may indicate minimal impurity if a single class is overwhelmingly represented. One should be mindful of this effect, because the decision boundary might still be important for minor classes, and pure Gini-based splits might not necessarily produce the best classification results for those minority classes. Techniques such as class weighting, undersampling, or oversampling could be applied to mitigate imbalance issues and ensure that the minor classes are considered more carefully.
Potential Problems
Overfitting can occur if you keep splitting until each leaf is completely pure. Once a node becomes pure (Gini = 0), it doesn’t necessarily contribute to generalization ability. Typical solutions include pruning, setting a maximum tree depth, or establishing a minimum number of samples per leaf to stop growing the tree prematurely.
Why Gini Over Other Criteria
Some practitioners prefer the Gini Index because it tends to split on the most frequent class, yielding simpler and often more interpretable trees. Although the entropy-based approach (from Information Gain) and Gini-based approach usually lead to similar trees, Gini is sometimes preferred for its computational simplicity. On the other hand, entropy is sometimes seen as more theoretically grounded because it links more closely to the concept of information theory. In practice, both are valid and yield similar performance.
How to Visualize a Decision Tree with Gini
When employing Decision Trees in practice, many libraries such as scikit-learn allow you to print or plot the constructed tree. The display typically indicates how each split was chosen, the Gini Index at each node, and the classification distribution for that node. This helps in understanding the model’s logic and verifying it against domain knowledge.
How to Handle Continuous Variables
For continuous features, the Decision Tree algorithm tries different split points (e.g., feature < 5.2, feature < 10.3, etc.) to see which threshold most effectively reduces the Gini Index. This is done by sorting values of that feature and searching for the best dividing threshold that yields the maximum decrease in impurity. For datasets with numerous numeric features, it is important to do this process efficiently to avoid excessive training times.
Follow-up Questions
How does Gini Index compare with Entropy in Decision Trees?
Gini and Entropy are two distinct metrics for measuring impurity. While both are used similarly in building Decision Trees, the Entropy metric is -sum_{k}(p_k * log(p_k)) in text. The main difference is that Entropy relies on a logarithmic function, which can slightly change the sensitivity of the split. Gini puts emphasis on misclassification rates by summing up the probabilities p_k (1 - p_k) in text. In practical usage, Gini and Entropy often result in similar splits, but Gini can be slightly faster to compute since it avoids log calculations.
Is the Gini Index always preferred over Entropy?
Not always. Both criteria are widely used. Gini is common in CART (Classification and Regression Tree) implementations, while Entropy-based information gain is used in ID3 or C4.5 style algorithms. They usually produce similar performance. The choice might depend on personal preference, computational considerations, or historical convention within a particular organization or codebase.
Does the Gini Index work for multi-class classification?
Yes. Gini extends naturally to multi-class problems by simply summing p_k (1 - p_k) in text for k from 1 to C. Regardless of how many classes there are, the algorithm measures impurity by considering how evenly (or unevenly) the classes are distributed in a given node.
How does Gini handle missing values?
Handling missing values is not built directly into the Gini Index calculation. Instead, typical strategies involve either imputing missing values before training, or using an algorithm that can handle missing values by distributing them proportionally among branches or by using surrogate splits. The calculation of the Gini Index itself remains the same for the non-missing data once you decide how to handle those missing rows.
How to avoid overfitting if we keep splitting until each node is pure?
Typical techniques include pruning (cutting back certain branches based on validation data), imposing a maximum tree depth, specifying a minimum number of samples in a leaf node, or setting a threshold for the minimum impurity decrease at each split. These methods prevent the tree from growing to a point where each leaf node is perfectly pure but fails to generalize to unseen data.