
ML Interview Q Series: What key metrics would you track on a company-wide dashboard for a DTC sock e-commerce platform?
📚 Browse the full ML Interview series here.
Comprehensive Explanation
One of the most important areas to evaluate in a direct-to-consumer e-commerce business is determining how well the company’s strategies and operations translate into revenue and sustainable growth. Monitoring specific metrics offers actionable insights into every phase of the customer journey, from attracting new users, to converting them into paying customers, to retaining them over the long term.
Revenue and Profitability
Revenue remains central to tracking any business’s overall viability. Although absolute revenue figures are critical, profit margins provide a more refined outlook on long-term sustainability.
Gross Profit Margin
Gross Profit Margin focuses on how much you earn after considering the direct costs of production (or purchasing, shipping, etc.) before other expenses like marketing or administration. This can be monitored monthly or quarterly to ensure stable product profitability.
Conversion Rate
E-commerce performance often hinges on the ratio of website visitors who turn into paying customers. The most straightforward way to define Conversion Rate is:

Parameters:
Number of Purchases: total count of successful transactions in a given period.
Number of Visitors: total number of unique visitors to the site in the same period.
A high conversion rate might indicate an effective user experience, strong product-market fit, or successful marketing campaigns. A low rate typically signals friction in the purchase funnel, poor targeting, or an irrelevant product offering.
Average Order Value (AOV)
Average Order Value measures the average spending per transaction. This is helpful to know the buying behavior of your customers.
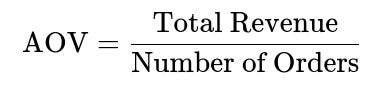
Parameters:
Total Revenue: the total revenue made in a specific time frame.
Number of Orders: the total number of orders placed during that same time frame.
Increasing AOV can be attempted through cross-selling, up-selling, or bundling strategies.
Customer Acquisition Cost (CAC)
Customer Acquisition Cost is how much it costs to attract a new customer through all marketing channels. It can be measured with the following formula:

Parameters:
Total Marketing and Sales Expenditure: sum of marketing, advertising, and sales-related costs over a specific period.
Number of New Customers Acquired: total count of unique new buyers during that period.
If CAC grows faster than the revenue generated by newly acquired customers, the business’s profitability can become problematic.
Customer Lifetime Value (CLV)
Customer Lifetime Value provides an estimate of the net profit contributed by the entire relationship with a single customer, from their first purchase to their last. A simplified version of CLV can be expressed as:

Parameters:
Average Order Value: how much revenue the customer typically generates per purchase.
Purchase Frequency: how often a typical customer makes a purchase within a given time span.
Average Customer Lifespan: the average duration (in months or years) that a customer remains active.
Tracking CLV helps a D2C company figure out whether the returns on marketing justify the costs of acquisition and retention.
Churn Rate and Retention Rate
Churn Rate focuses on the percentage of customers who stop buying your product over a specific time. If your churn is high, then your business must spend considerably on acquisition just to replace lost customers. In contrast, Retention Rate reveals how many customers consistently return to make repeat purchases.
Return Rate
For a D2C socks business, tracking the Return Rate (or Refund Rate) is important to gauge product satisfaction, fit, and overall quality. High return rates can expose product issues such as incorrect sizing, poor quality, or inaccurate product descriptions.
Inventory Turnover
Managing physical sock inventory is crucial. If inventory turnover is too slow, capital remains tied up, storage costs rise, and unsold stock might become obsolete (style changes, seasonal demands, etc.). Conversely, a very fast turnover could indicate low on-hand inventory, leading to stock-outs and lost revenue.
Net Promoter Score (NPS)
NPS measures how likely customers are to recommend your brand or products to others. It is a leading indicator of customer satisfaction and brand loyalty, both of which strongly affect long-term growth.
Website Performance Metrics
Page load speed, bounce rate, and session duration help identify customer experience friction points. Even minimal latency in website loading can significantly impact conversion.
Potential Follow-up Questions
How do you decide which metrics matter most at each stage of company growth?
Early-stage D2C businesses might place high emphasis on Conversion Rate, CAC, and brand awareness metrics to build initial traction. As the operation matures, the focus might shift to metrics like CLV, Retention Rate, and profitability measures. Prioritization depends on whether the primary objective at a given time is rapid user acquisition, operational efficiency, or maximizing long-term profitability. Balancing short-term metrics (CAC, revenue growth) with long-term metrics (CLV, brand loyalty) is critical to scalable success.
What actions might you take if the Conversion Rate is lower than expected?
A low Conversion Rate can be addressed by improving user experience, offering targeted discounts to increase purchase intent, or ensuring the site design is aligned with user expectations. A site audit could reveal issues such as complicated checkout flow, poor-quality product images, or shipping/delivery uncertainties. You can run A/B tests on critical elements like the layout of the product pages, CTA button design and text, and shipping information to see which changes positively affect conversions.
Why might Customer Lifetime Value (CLV) differ from one customer segment to another?
Different customer segments may have varied purchase frequencies or average order values. Demographic and psychographic differences contribute to distinct buying patterns—for instance, some customers might only buy socks for special occasions, while others might purchase them frequently due to style preferences or gift-giving needs. In addition, marketing campaigns may selectively attract customers more likely to be loyal. Identifying high-CLV segments helps concentrate marketing resources effectively.
How do you incorporate seasonality into these metrics?
Seasonality can affect both traffic and purchase behavior. For a socks business, colder months might see an uptick in demand for thicker, warmer socks, while novelty socks might sell well during holiday seasons. Tracking historical data allows you to predict cyclical patterns. Adjusting marketing spend, inventory, and promotions to align with these seasonal swings can smooth out operational challenges and optimize revenue.
Could you give a small Python snippet that calculates some of these metrics from raw data?
# Suppose we have a pandas DataFrame named orders_df with columns:
# 'order_id', 'customer_id', 'order_value', 'order_date'
# And suppose we have a marketing_cost variable representing total marketing expenditure.

import pandas as pd

# Example DataFrame
data = {
    'order_id': [101, 102, 103, 104],
    'customer_id': [1, 2, 1, 3],
    'order_value': [20.0, 35.0, 25.0, 40.0],
    'order_date': pd.to_datetime(['2025-03-01', '2025-03-02', '2025-03-15', '2025-03-20'])
}

orders_df = pd.DataFrame(data)
marketing_cost = 200.0

# Total Revenue
total_revenue = orders_df['order_value'].sum()

# Number of Orders
total_orders = orders_df['order_id'].nunique()

# Number of Unique Visitors -> this would come from web analytics, e.g. Google Analytics
num_visitors = 150  # hypothetical example

# Conversion Rate
conversion_rate = total_orders / num_visitors

# Average Order Value
aov = total_revenue / total_orders

# Number of New Customers in this period -> count unique customer_ids that appear for first time
# For demonstration, assume all are new, or you can track repeated vs new by checking a user database
new_customers = orders_df['customer_id'].nunique()

# Customer Acquisition Cost
cac = marketing_cost / new_customers

print(f"Total Revenue: {total_revenue}")
print(f"Conversion Rate: {conversion_rate:.2f}")
print(f"Average Order Value (AOV): {aov:.2f}")
print(f"Customer Acquisition Cost (CAC): {cac:.2f}")
In this snippet, the visitor count is assumed, but in practice, you would get it from a web analytics tool. Furthermore, tracking first-time versus repeat customers can be managed through a more sophisticated approach to identify actual new customer acquisitions.
How do you prevent misleading interpretations of these metrics?
Proper segmentation and contextual analysis are crucial. For instance, raw conversions without knowing the visitor source can be misleading. Campaign-based conversions should be scrutinized to ensure marketing spend is efficient. Similarly, spikes in Conversion Rate might coincide with large discounts that reduce overall profit margin. Continuous monitoring of multiple complementary metrics, along with consistent definitions and data hygiene, helps avoid misinterpretations.
Could focusing on one metric lead to unintended consequences for others?
Over-prioritizing a single metric (for example, Conversion Rate) may motivate giving heavy discounts or free shipping, which might boost conversions but degrade profitability or average order value. Similarly, aggressively lowering CAC by slashing marketing spending can hinder brand awareness, thereby stunting long-term customer acquisition. Balancing metrics against each other helps maintain holistic growth.
Below are additional follow-up questions
How can multi-touch attribution be approached in an e-commerce funnel for socks?
Multi-touch attribution aims to give credit to every marketing interaction that guides a user toward conversion. In many e-commerce settings, each visitor’s path can involve multiple touchpoints before they finally make a purchase: a social media ad, email newsletter, search engine click, etc. To implement multi-touch attribution:
• Data Collection You need robust tracking systems (e.g., Google Analytics, UTM parameters, CRM integrations) to capture interactions from first touch to last touch. Every data entry must include a unique identifier (session IDs, cookies, or hashed user IDs) so that you can connect each touchpoint to a single user journey.
• Attribution Models
Linear: Each touchpoint gets equal credit toward a conversion.
Time-Decay: Touchpoints closer to the conversion event receive more weight.
Position-Based: The first and last interactions get heavier credit than the middle interactions.
Algorithmic: Uses data-driven methods like Markov chains or Shapley values to assign credit based on actual observed outcomes.
• Pitfalls and Real-World Concerns
Cross-Device Tracking: A single user might browse on mobile and then purchase on desktop, creating incomplete tracking if the systems are not integrated.
Data Privacy Constraints: With regulations like GDPR and potential browser restrictions (e.g., cookie expiration, tracking protection), you may lose visibility of some data.
Overlooking Offline Influences: Word-of-mouth or offline advertising might not be easily captured in a digital attribution framework.
• Detailed Usage Once you accurately gather multi-touch data, you can optimize marketing budgets by channel. For instance, if time-decay attribution reveals that social media ads commonly re-engage near checkout, you might direct more resources to social re-targeting to boost final conversions.
What are the best practices for handling outliers or anomalies in these metrics?
Outliers in revenue, conversion rates, or any other key metric can distort decision-making. Some crucial considerations:
• Identification
Statistical Approaches: You can set thresholds like 3 standard deviations from the mean or use interquartile range methods to flag extreme data points.
Domain Knowledge: If a single user spends an extraordinarily large sum on custom or bulk sock orders, that might be a legitimate transaction rather than a data error.
• Treatment
Exclude or Cap: For metrics like Average Order Value, you might cap extremely high values if they’re out-of-scope.
Winsorization: Replace extreme data points with boundary values (e.g., the 95th percentile) to reduce skew.
Segmentation: Place outlier users or orders in a separate segment to analyze them independently. Sometimes outliers can reveal high-value segments worth exploring.
• Pitfalls
Over-Cleaning: Removing too many outliers can cause you to lose potential insights about niche but profitable customer segments.
Automating Without Oversight: Relying solely on algorithmic detection risks discarding legitimate unusual business events (like a corporate bulk sock order).
Which metrics are most useful for forecasting demand and inventory planning?
Forecasting demand for a sock business must balance your supply chain constraints, marketing strategy, and consumer buying behavior. Useful metrics:
• Historical Sales Trend Understanding past monthly or weekly sales is the baseline for predictive modeling.
• Seasonality Indices Socks might be especially popular during cold months or holiday periods, so you track year-over-year patterns to find recurring spikes.
• Promotional Event Data Promotions can lead to one-time surges that might not represent typical demand. Excluding or adjusting for promotional periods helps yield more accurate baseline estimates.
• Lead Time If supply chains take a few weeks (or more) to deliver stock, you must forecast far enough in advance to avoid stock-outs.
• Pitfalls
Overestimating Demand: Leads to excessive inventory carrying costs and potential markdowns if your predictions are too high.
Underestimating Demand: Causes stock-outs, missed revenue, and possible damage to brand reputation.
• Models
Simple Moving Average or Exponential Smoothing: For short-term, stable demand scenarios.
ARIMA or SARIMA: Accounts for seasonality and autocorrelation.
Machine Learning Models: Combine external data (e.g., weather, market trends) to refine predictions.
How do you increase the Average Order Value (AOV) without damaging the Conversion Rate?
Increasing AOV and maintaining a healthy Conversion Rate can conflict if you push too aggressively for upsells or bundles. Some balanced strategies:
• Relevant Upsells Suggest complementary items that align with the customer’s selected sock category (e.g., moisture-wicking socks for running shoes, or fashionable sock bundles for dress wear). This improves the chance of adding extra items without deterring the customer.
• Tiered Pricing or Bundling Offer price advantages for purchasing multiple pairs. Make sure the total cost seems reasonable so that a potential buyer is not turned away entirely by a larger upfront cost.
• Limited-Time Bundles Scarcity can encourage buyers to add more items to their cart, but be careful to avoid appearing manipulative. Transparent messaging about the true savings fosters trust.
• Pitfalls
Overcomplicating Checkout: If your upsell process adds friction, you risk cart abandonment.
Discount Diminishment: Too many discount-based upsells can undermine brand value and long-term profitability.
How do you measure brand awareness beyond direct online metrics?
Brand awareness refers to how well your target audience recognizes or recalls your sock brand even when they aren’t actively searching for it. Measuring it goes beyond raw web metrics:
• Branded Search Volume Monitor how many organic queries on search engines include your brand name. A trend upward in these queries can suggest growing brand recognition.
• Social Media Mentions and Share of Voice Track how often your brand or product is mentioned relative to competitors. Tools like Sprout Social, Brandwatch, or NetBase can help with sentiment analysis.
• Customer Surveys Conduct direct surveys asking how customers discovered your brand. This can highlight whether brand recall is strong or if marketing campaigns are resonating.
• Influencer Collaborations If you partner with influencers or run brand sponsorships, track engagement and mention frequency (even if it doesn’t lead to an immediate purchase).
• Pitfalls
Attribution to a Single Source: Brand awareness is often the result of multiple channels (word-of-mouth, social ads, events), so it’s risky to credit one factor entirely.
Lag in Impact: Brand-building campaigns can yield delayed effects, so measuring short-term conversions alone might underestimate their true value.
How can you comprehensively evaluate the performance of different marketing channels?
When you run marketing on channels such as Facebook, Instagram, Google Ads, or email, each channel has unique customer touchpoints. To evaluate them:
• Channel-Specific Metrics Look at cost-per-click, click-through rate, and conversion rate by channel. This indicates how effectively each platform drives engaged traffic.
• Attribution and Cohort Analysis
Attribution: Assign credit accurately across multiple channels using multi-touch or last-touch models.
Cohort Analysis: Group new customers by the channel that acquired them and track their behaviors and repeat purchases over time.
• Lifetime Value by Channel High initial conversions from a channel do not always translate into high-value customers. If a particular channel yields frequent return purchases and strong average order values, you might prioritize that channel despite a higher upfront CAC.
• Pitfalls
Duplicate Attribution: A customer may click on multiple ads from different platforms, making it easy to double-count conversions.
Ignoring Long Sales Cycles: Some customers need repeated interactions before purchasing socks, especially if they wait for a specific event or season.
What if inventory costs suddenly spike? How can that affect margin calculations and business-health metrics?
A sudden rise in the cost of raw materials or shipping can disrupt carefully planned margins:
• Impact on Gross Profit Margin If your cost of goods sold (COGS) unexpectedly increases and you don’t adjust pricing immediately, your gross profit margin shrinks. This can mask downward trends if you only track top-line revenue without monitoring margins.
• Potential Cash Flow Issues Higher inventory costs tie up more working capital. If your sales cycle doesn’t adjust or if you lose some customers due to higher prices, you risk liquidity problems.
• Price Sensitivity Deciding to pass on the higher cost to customers can hurt your Conversion Rate if shoppers find the new price point too high. Alternatively, absorbing the cost to maintain your price can erode net margins.
• Detailed Monitoring
COGS as a Percentage of Revenue: Track it regularly to ensure you’re not slowly drifting into unprofitability.
Margin Trends: Look for dips in gross margin across different time frames; a short-term dip might be a temporary supply chain issue, whereas a sustained dip signals a long-term cost or pricing challenge.
• Mitigation Strategies
Supplier Diversification: If reliant on one supplier, seek alternative sources to mitigate price hikes.
Negotiating Bulk Orders: Placing larger orders might earn you discounts, but you also risk holding excess inventory.