
ML Interview Q Series: What purpose does Fuzzy C-Means Clustering serve in data analysis, and in what situations is it most beneficial?


📚 Browse the full ML Interview series here.
Comprehensive Explanation
Fuzzy C-Means (FCM) clustering is a soft clustering technique that, unlike hard clustering (such as K-Means), allows data points to belong to multiple clusters with varying degrees of membership. Instead of assigning each sample to exactly one cluster, FCM computes a membership value for each cluster. This enables the algorithm to capture more nuanced patterns in data, especially when cluster boundaries are not strictly distinct.
It can be particularly useful in scenarios where data points share overlapping characteristics (such as partially belonging to more than one group). It is often employed in image segmentation (medical imaging, satellite imagery), pattern recognition, and any domain where flexible cluster boundaries are desirable.
Mathematical Core of Fuzzy C-Means
A fundamental objective function used in Fuzzy C-Means is as follows:
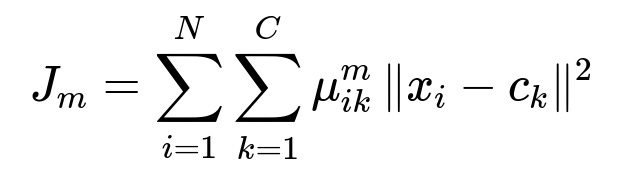
Where:
i ranges over the data samples from 1 to N (total number of samples).
k ranges over the clusters from 1 to C (total number of clusters).
x_i is the i-th data point.
c_k is the center of the k-th cluster.
mu_{ik} is the membership of x_i in cluster k. This membership value lies in [0,1].
m is a fuzziness parameter (often chosen between 1.5 and 2.5). It controls the degree of fuzziness in the membership assignments. A higher m makes clusters fuzzier.
The notation | x_i - c_k |^2 denotes the squared distance between x_i and cluster center c_k.
Minimizing the above objective function involves two iterative steps in the FCM algorithm:
Updating the membership values mu_{ik} based on the current cluster centers.
Updating the cluster centers c_k based on the current membership values.
This iterative process repeats until convergence, typically measured by the change in cluster centers or memberships dropping below a threshold or by reaching a maximum number of iterations.
How the Algorithm Works in Practice
Initialization One begins by choosing the number of clusters C, the fuzziness parameter m, and randomly initializing the cluster membership matrix or the cluster centers.
Membership Update Each data point x_i gets an updated membership value to each cluster k. When using Euclidean distance, the membership update usually depends inversely on the distance from x_i to c_k, normalized by distances to all cluster centers. Data points closer to a cluster center will get higher membership values for that cluster.
Cluster Centers Update The cluster centers c_k are recalculated using a weighted mean, where the weights come from the membership values. Intuitively, points with higher membership in cluster k contribute more to c_k.
Convergence The process continues iteratively until changes in membership values or cluster centers are below a set threshold, or a fixed iteration limit is reached.
Compared to K-Means, FCM is able to capture and model the scenarios where strict binary belonging does not reflect the true structure in the data. This can produce more meaningful clustering outcomes when boundaries between clusters are not well-defined.
Typical Implementation in Python
Below is a minimal example of how Fuzzy C-Means could be coded in Python. Many practitioners use established libraries like scikit-fuzzy for efficient and robust implementations.
import numpy as np

def initialize_membership_matrix(num_data, num_clusters):
    # Randomly initialize membership values
    membership = np.random.rand(num_data, num_clusters)
    # Normalize row-wise
    membership = membership / membership.sum(axis=1, keepdims=True)
    return membership

def compute_cluster_centers(data, membership, m):
    # membership is shape [num_data, num_clusters]
    # data is shape [num_data, num_features]
    num_clusters = membership.shape[1]
    numerator = np.dot((membership ** m).T, data)
    denominator = np.sum(membership ** m, axis=0).reshape(num_clusters, 1)
    return numerator / denominator

def update_membership(data, centers, m):
    num_data = data.shape[0]
    num_clusters = centers.shape[0]
    membership_new = np.zeros((num_data, num_clusters))

    for i in range(num_data):
        for k in range(num_clusters):
            dist_ik = np.linalg.norm(data[i] - centers[k])  # Euclidean distance
            if dist_ik == 0:
                # In practice, handle this carefully (avoid division by zero)
                membership_new[i, :] = 0
                membership_new[i, k] = 1
            else:
                # Update membership for cluster k
                # membership_new[i, k] = 1 / sum((dist_ik / dist_ij)**(2/(m-1)) for j in all clusters)
                denominator_sum = 0
                for j in range(num_clusters):
                    dist_ij = np.linalg.norm(data[i] - centers[j])
                    # If dist_ij == 0, handle carefully
                    ratio = (dist_ik / dist_ij) ** (2 / (m - 1)) if dist_ij != 0 else 0
                    denominator_sum += ratio
                membership_new[i, k] = 1.0 / denominator_sum

    return membership_new

def fuzzy_c_means(data, num_clusters, m=2.0, max_iter=100, tol=1e-5):
    # Initialize membership matrix
    membership = initialize_membership_matrix(data.shape[0], num_clusters)

    for _ in range(max_iter):
        centers = compute_cluster_centers(data, membership, m)
        membership_new = update_membership(data, centers, m)
        if np.linalg.norm(membership_new - membership) < tol:
            break
        membership = membership_new
    return membership, centers

# Example usage:
if __name__ == "__main__":
    # Dummy data
    data = np.array([[1.0, 1.0], [1.2, 1.1], [3.0, 3.2],
                     [5.0, 8.0], [5.5, 8.2], [6.0, 8.1]])

    cluster_membership, cluster_centers = fuzzy_c_means(data, num_clusters=2, m=2.0)
    print("Final Membership Matrix:")
    print(cluster_membership)
    print("Cluster Centers:")
    print(cluster_centers)
In practice, you will often use a well-tested library rather than implementing from scratch, but this example helps illustrate the iterative flow of the algorithm.
Interpretability Benefits
One major advantage is the ability to interpret the degree of belonging for each data point. When you look at the membership matrix, you can quickly identify points that strongly belong to one cluster (membership near 1.0) or are intermediate between multiple clusters (membership spread out among clusters).
This can help in:
Image segmentation tasks: Assigning partial memberships to boundaries in an image region.
Customer segmentation: Capturing overlapping groups of customers who might share characteristics with multiple clusters.
Handling Overlapping Clusters
In many real-world problems (for instance, patients showing partial symptoms for multiple health conditions), it is unrealistic to assign each subject to exactly one distinct category. FCM is more flexible in that scenario because it acknowledges the continuum between categories.
Potential Follow-Up Questions
How does the fuzziness parameter m influence the result?
A larger m spreads membership values more evenly across clusters, leading to “softer” clusters. If m approaches 1, FCM tends to behave more like a hard clustering algorithm (similar to K-Means). In practice, m is often set between 1.5 and 2.5, and the choice might depend on how much overlap you expect among clusters.
What are the drawbacks of Fuzzy C-Means?
Fuzzy C-Means can be more computationally expensive than K-Means because of its additional membership computation. It is also sensitive to the initial choice of cluster centers or membership values. Furthermore, just like K-Means, it can get stuck in local optima, so multiple runs with different initial conditions might be necessary for better results. Another pitfall is that you still need to choose the number of clusters C, which might not be trivial.
When might Fuzzy C-Means be preferred over other clustering methods?
It is particularly preferred when the data has overlapping class boundaries and you want a more nuanced membership representation. For example, in medical image analysis or in multi-label contexts in marketing data, partial belonging to more than one category is quite common. In such scenarios, FCM can produce more meaningful results compared to hard clustering techniques.
Could we use Fuzzy C-Means in high-dimensional settings?
Yes, it can be applied in high-dimensional spaces, but like other clustering algorithms, it can suffer from the curse of dimensionality. As the number of dimensions grows, distance-based metrics can become less meaningful. Dimensionality reduction techniques or domain knowledge might be used before applying FCM to improve clustering performance and interpretability.
Is there a way to automate the selection of the number of clusters for Fuzzy C-Means?
In practice, people often use validation indices such as the Fuzzy Silhouette Index, Partition Coefficient, or other cluster validity measures to evaluate the quality of clustering for different values of C. By computing a cluster validity metric for multiple candidate cluster counts, you can choose the number of clusters that yields the best score. However, this process can be time-consuming and requires domain knowledge to pick an appropriate validity measure.