
ML Interview Q Series: Why Regression R² Exceeds 1: Investigating Data Leakage and Metric Calculation Errors.

📚 Browse the full ML Interview series here.
Suppose I have a regression problem where I am applying the R² metric and doing lots of hyperparameter tuning. The final score I get is 1.039. Is this a good model or a bad model? Justify.


from sklearn.metrics import r2_score
import numpy as np

# Suppose y_true and y_pred are numpy arrays of the same shape
y_true = np.array([3.2, 2.8, 3.5, 3.1])
y_pred = np.array([3.3, 2.7, 3.6, 3.0])

score = r2_score(y_true, y_pred)
print("R^2:", score)


It is critical to replicate the metric calculation in another environment or using different libraries if possible. That means, for instance, if you originally used scikit-learn, try computing the residuals manually and verifying the sums of squares. Compare your results with:
import numpy as np

# Suppose y_true and y_pred are numpy arrays
rss = np.sum((y_true - y_pred)**2)  # residual sum of squares
tss = np.sum((y_true - np.mean(y_true))**2)  # total sum of squares
r2_manual = 1 - rss / tss
Make sure these arrays correspond to a proper test split. If this calculation confirms the original result, then investigate the data pipeline step by step for potential leakage or transformations. If no error is found and you legitimately have a very accurate model on your test set, keep in mind that you may have inadvertently created a test split that is too easy or not representative of the true distribution.
Below are additional follow-up questions
What is the difference between R² and adjusted R², and can adjusted R² also exceed 1?
Adjusted R² is a variation of the coefficient of determination that accounts for the number of features (or predictors) used by the model relative to the number of observations. The typical formula is:
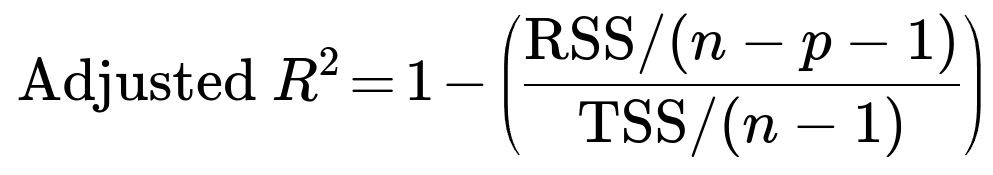
where RSS is the residual sum of squares, TSS is the total sum of squares, n is the number of samples, and p is the number of features. In words, this version penalizes adding more features that do not sufficiently improve the model’s predictive performance. The question then arises whether adjusted R² can also exceed 1.
In most correct real-world scenarios, adjusted R² remains below 1. However, under similar problematic conditions that allow regular R² to go above 1—such as data leakage, an extremely small dataset with many features, or improper transformations—adjusted R² could also exceed 1. Though this is even more unusual because the adjustment explicitly tries to prevent overly optimistic values, it may still happen if the variance in the residuals becomes extraordinarily small or if there is some inadvertent overlap between training data and test data when computing the statistic. From a practical perspective, if you see an adjusted R² above 1, it signals an even stronger likelihood of data or methodological issues than a raw R² above 1. Always examine the possibility of data leakage, confirm that the penalty term has been applied correctly, and verify the formula that was used in the computation.
Real-world edge cases might involve very high-dimensional feature spaces with minimal regularization or advanced dimensionality reduction steps that effectively “memorize” the training set. In such scenarios, if the test data are not genuinely held-out, or if the adjusted R² is calculated over a non-independent dataset, it can appear inflated. But, typically, a carefully validated regression pipeline should keep adjusted R² at or below 1, reinforcing that values above 1 often indicate deeper errors rather than bona fide performance gains.
If the dataset has extremely low variance in the target variable, can that lead to inflated R² scores?
Yes, if the target variable shows very little variation around its mean, any model that captures that limited fluctuation with relatively small absolute errors might produce a ratio in the R² formula that pushes close to or even beyond 1. The total sum of squares, which depends on the spread of the ground truth around its mean, will be very small if the range of target values is narrow. This can cause:

to be tiny. If your model’s residual sum of squares is similarly small but not proportionally so, it might create an unexpectedly large or even negative fraction inside the calculation for R², leading to a value above 1.
A related pitfall occurs if you are segmenting your dataset into subsets (for instance, for different categories or conditions) and one subset has extremely low variance in the target. In that subset, the model might appear to have an extraordinarily high R². Before interpreting such results, it is crucial to investigate whether the phenomenon is merely a statistical artifact or if the data truly show minimal variability and a near-perfect model fit. In most realistic scenarios, seeing R² beyond 1 in a low-variance subset serves as a warning sign that you might need to revisit your train/test split or confirm the correctness of the metric computation.
Could polynomial or high-order models cause R² to exceed 1 on a test set?
In principle, a polynomial or more flexible model can fit the training data extremely well, occasionally leading to a near-zero residual on those samples. But when evaluated on a valid and independent test set, that same model typically exhibits higher error. Hence, the usual manifestation of overfitting is an R² close to 1 on the training set but a more modest R² on the test set.
However, if the test set has been compromised—for example, if it is not truly independent or inadvertently includes the same data points used in training—then a high-order polynomial could appear to achieve R² values above 1. This might happen if the model effectively memorizes the target, and the test set is not challenging it with new information. A polynomial basis expansion in combination with data leakage can artificially inflate performance metrics. Consequently, while a polynomial model alone will not inherently yield R² above 1 on a properly separated test set, the addition of data leakage or a severely limited, non-independent test set can indeed push the metric over 1.
Always ensure that cross-validation folds or a held-out test split remain strictly separate from the training data, particularly when using high-order expansions or other methods that can drastically increase model complexity.
Can an extremely large number of features in a linear model lead to R² above 1 on the test set?
Under a legitimate training and test split, simply using a large number of features will not, by itself, cause R² to exceed 1. Overfitting might occur, but on a genuinely unseen test set, the R² should usually not surpass 1 unless there is a data leakage problem or the test set is not truly unseen.
In some corner cases, if the test set is very small or unrepresentative, a model with a vast number of features might perfectly predict those few data points, making the residual sum of squares tiny. Meanwhile, if the total sum of squares (associated with the minimal variance in the small test subset) is not as tiny in proportion, you might see an R² above 1. But such situations generally indicate that the test set is too small or not appropriately chosen.
In real industrial environments, large-scale data pipelines use cross-validation or multiple random splits to mitigate the chance of stumbling into such anomalies. Still, if an R² above 1 arises in this context, it is advisable to re-check the sampling procedure and verify the dimensionality. In short, while a massive feature set does not directly cause R² to exceed 1, it raises the risk of data leakage or overfitting that can manifest in suspiciously high metrics on inadequately split data.
What if I see R² greater than 1 only on certain cross-validation folds but not on the overall average?
Sometimes, when performing k-fold cross-validation, you might compute the R² for each individual fold and then average them at the end. If one of those folds has unusual data characteristics (very low variance in the target or a small sample size after the split), you could see an R² value above 1 for that fold. The other folds might show more “normal” values, causing the final averaged R² to be below 1.
Even if the overall mean of the R² across folds is below 1, an individual fold’s unusual result should prompt you to investigate that fold specifically. There could be data leakage restricted to that fold, a misalignment in the data (e.g., the train/test boundaries in that fold are incorrectly defined), or an atypical distribution of the target in that subset. An important real-world practice is to review the distribution of the metric across all folds rather than only focusing on the mean, as outlier folds may reveal deeper issues in the data processing pipeline.
If I apply feature selection incorrectly, can that inflate R² above 1?
Improper feature selection can inadvertently cause data leakage. One scenario is when the feature selection algorithm uses the entire dataset, including the test portion, to choose which features are most predictive of the target. Once those features are selected, the model is trained and tested on data that influenced feature selection, thereby contaminating the test set with knowledge of the target. This can lead to artificially low errors on the test set, potentially pushing R² above 1.
The correct procedure is to ensure that feature selection is included inside the cross-validation loop or is done strictly on the training fold before applying the selected features to the test fold. If you see an R² exceeding 1 after applying feature selection, check whether the selection was done in a manner that respects the boundaries between training and test data. You should confirm that each cross-validation fold performs feature selection only on the training subset for that fold.
Could we have a scenario where a custom loss function or custom evaluation approach yields an R² above 1?
In typical regression pipelines that rely on standard definitions of R², the possibility of exceeding 1 typically arises from the standard issues of data leakage, flawed splitting, or minimal variance. However, sometimes practitioners customize their training loop or override the way predictions are generated. If that process modifies how predictions are computed (for example, applying specialized post-processing that inadvertently uses true target information), the model’s predictions might align suspiciously well with the target, driving the error term down near zero.

If R² is above 1 for a particular regression model, does it imply the model is definitely wrong?
Not necessarily “wrong,” but almost certainly suspicious. A model might produce an R² above 1 due to:
Data leakage: The most likely culprit, where information about the target is in the features or where the test set overlaps with the training set.
Incorrect metric computation: Possibly computing R² with mismatched predictions and ground truth arrays or applying a transformation incorrectly.
Tiny test set or minimal variance: If the target in the test set barely varies, small errors can look disproportionately good.
A specialized domain scenario: In extremely rare and carefully controlled circumstances, a model might indeed approximate the target to a degree that the ratio in the R² formula goes above 1. However, in day-to-day practice, such a phenomenon is exceptionally rare and typically denotes a pipeline error. In short, R² above 1 is a strong red flag to re-check each step in the data lifecycle.
Does normalizing or standardizing the target affect the possibility of exceeding R² = 1?

If the conversion between these scales is done incorrectly (for example, forgetting to unstandardize predictions or incorrectly applying the standardization parameters), you might inadvertently compress or expand the range of predicted values. When that mismatch skews the distribution of errors relative to the distribution of true values, R² could appear anomalously large. To avoid that confusion, always ensure that the final R² is computed on the same scale as the real-world target values unless there is a specific reason to do otherwise. Any mismatch in the transformation of predictions and ground truth can lead to spurious metric values, including those above 1.