
ML Interview Q Series:Imagine you're working at a rideshare company like Lyft & you plan to test 3 different cancellation fees.How would you determine which fee is the best choice to adopt?

📚 Browse the full ML Interview series here.
Comprehensive Explanation
A core challenge in choosing an optimal cancellation fee is balancing potential revenue from cancellation fees with user experience, retention, and overall profitability. The approach often involves a carefully designed A/B (or in this case, A/B/C) test to compare the three fee variants under real-world conditions while monitoring key metrics.
One strategy is to randomly assign users to one of the three fee groups, track outcomes over a sufficient period, and evaluate which fee leads to the most favorable balance of metrics such as completed trips, driver availability, user satisfaction, net revenue, and churn. Because three different options exist, it is essential to set up a multi-variant experiment that distributes users as evenly as possible among the $1, $3, and $5 fee groups.
Several important factors come into play:
User Behavior Effects: A lower fee might entice users to try more rides but could result in higher cancellation rates since the penalty is small. A higher fee might deter frivolous cancellations but could push some customers to other services if they feel penalized too heavily.
Statistical Significance: After data collection, a hypothesis test or confidence interval analysis helps determine whether any observed differences in outcomes (e.g., revenue per ride, user churn, average cancellation rates) across the three groups are statistically significant. Proper randomization reduces bias by ensuring each user segment is represented across all fee groups.
Experiment Duration: Each group requires enough time and a sufficiently large sample to yield meaningful data. The time horizon should account for variations in demand, day-of-week behavior, location-based differences, and possible novelty effects.
Potential Confounding Variables: External factors like local events, promotions, marketing campaigns, or seasonal demand shifts can affect user behavior. Controlling for these or distributing them evenly across groups is critical for a fair comparison.
Implementation Considerations: Back-end logic is needed to ensure the correct fee is charged when a user cancels. This includes straightforward tracking in the app or service platform, logging those cancellations, and attributing each cancellation event to the right test group.
Core Mathematical Framework for Group Comparisons
When deciding which fee to adopt, a common approach involves comparing averages of key metrics across the three groups (for example, average cancellation rate or average net revenue). If we consider comparing two groups at a time, say group i and group j, a difference-of-means test can be performed. One representative formula for a two-sample comparison, assuming normality and large enough samples, might look like the following:
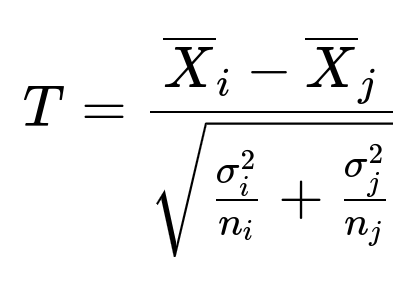
Here is what each parameter means in plain text: T is the test statistic for comparing two groups. X_i is the sample mean of the relevant metric (e.g., average cancellation rate) for group i. X_j is the sample mean of the relevant metric for group j. sigma_i^2 is the variance of the relevant metric within group i. sigma_j^2 is the variance of the relevant metric within group j. n_i is the sample size in group i. n_j is the sample size in group j.
This statistic (T) typically follows a distribution (often approximated by a t-distribution or a z-distribution for large n) that we can use to calculate p-values or confidence intervals. For three groups ($1, $3, and $5), you can extend this to an ANOVA framework or run pairwise comparisons with appropriate corrections for multiple testing (to avoid inflating the Type I error rate).
Beyond statistical measures, the choice might also hinge on strategic considerations: for instance, if the difference in net revenue between $3 and $5 fees is small but the negative impact on user ratings is large at $5, Lyft might conclude that $3 is more optimal in the long run.
Follow-Up Questions
How to set the evaluation metric for deciding the best fee?
One might define a primary metric such as overall net revenue generated or profit from the entire ride lifecycle. This could incorporate the fee itself, user retention, brand loyalty, and the likelihood of future rides. Secondary metrics could be user satisfaction (through ratings or complaints), changes in cancellation rate, and impact on driver compensation. Evaluating multiple angles ensures that a higher fee does not inadvertently harm user loyalty.
It is important to establish in advance which metric will be treated as the main decision driver. For a rideshare service, if revenue alone is used, subtle long-term user churn might be missed. Conversely, if user satisfaction is the sole metric, revenue opportunities might be overlooked. A combined or weighted approach often gives a holistic picture of trade-offs.
How to decide on the experiment's sample size and duration?
The necessary sample size and test duration depend on the expected effect size. For instance, if you expect to see a small difference in cancellation rates or net revenue between $3 and $5, a larger sample might be necessary to detect that difference confidently. Typical steps include:
Formulating a hypothesis about the smallest effect you care about (sometimes called the Minimum Detectable Effect). Using known or estimated variance for relevant metrics to approximate how many user samples are required per group to achieve a specific power (e.g., 80% or 90%) for detecting the effect. Determining the test duration to gather that many samples while also spanning typical usage cycles (for example, weekdays vs. weekends, months with high vs. low demand, etc.).
In practice, many organizations utilize specialized power analysis tools or standard formulas to compute sample size given parameters like significance level (alpha), power (1 - beta), and the effect size. Once determined, you run the experiment for that minimum time or number of user samples.
How to analyze results when user subgroups respond differently?
It is common for different user segments to show varying sensitivities to pricing changes. For example, high-frequency riders might be more tolerant of higher fees, whereas occasional riders might be more price sensitive. To handle segmentation:
Perform segmented analyses by city, usage frequency, or user type (e.g., corporate vs. personal rides). Compare how each segment responds to the new fee to see if the recommended fee is universally beneficial or only profitable in some segments. Use methods like interaction effects in regression models or custom dashboards that allow filtering by demographic or usage variables.
If substantial differences emerge, it might be beneficial to consider personalized or location-based cancellation fees, but that adds complexity to the system and might raise fairness or user perception challenges.
How to handle confounding variables like promotions or competitor moves?
During the experiment, external factors such as marketing promotions or competitor discounts can interfere with analysis. To reduce bias:
Ensure that each experimental group is exposed to promotions as equally as possible. If a competitor runs an aggressive marketing campaign during your test, record the timeline and possibly segment data by time frames unaffected by that campaign. Use control variables in a regression-based analysis if randomization alone does not mitigate certain known confounders.
External events can be unpredictable, so it's best to track them carefully and either prolong the experiment or exclude data from abnormal periods if they disproportionately affect one group over another.
In an interview setting, mentioning how you would robustly identify and account for confounding variables reflects depth of knowledge, as real-world experiments are rarely perfectly controlled.
How to maintain the experiment’s scalability and integrity?
When implementing multiple fee variants at scale, performance and consistency of the backend are crucial. You can:
Assign a unique experiment identifier to each user the moment they open the app, caching the assigned group so the fee remains consistent throughout their entire usage period. Log every cancellation event with metadata containing the assigned fee group and user ID to avoid mixing data across groups. Construct data pipelines that can efficiently process and aggregate daily results, ensuring the business can track intermediate metrics and quickly detect unexpected anomalies.
In a high-traffic system, the experiment must not degrade user experience or cause confusion. Conducting smaller pilot tests before a full rollout can catch implementation issues.
How to ensure user trust when changing fees?
Users might feel suspicious if fees fluctuate in unpredictable or uncommunicated ways. To mitigate potential damage to user perception:
Consider short-term testing on a small user base or with limited-time pilot programs while communicating a reason for the pilot. Ensure the terms of service allow variable or pilot-based fees. Respect user feedback by offering support and transparency when fee changes are introduced, especially if a user believes they were unfairly charged.
Ethical and transparent communication encourages long-term trust and good faith among the customer base, which is vital for a platform that relies on repeat usage and favorable word of mouth.
All these considerations, from experiment design and metrics selection to confounding factors and communication strategies, help ensure the final decision regarding the cancellation fee is supported by rigorous data, preserves user satisfaction, and aligns with the company's broader strategic goals.
Below are additional follow-up questions
How to ensure random assignment is truly random and not biased by user behavior?
One subtle pitfall in multi-variant testing is ensuring the assignment to different cancellation fee groups is random. In practice, biases might sneak in when certain user segments have a greater likelihood of receiving a particular fee variant due to concurrency constraints or system quirks.
A typical approach is to assign each user to a fee group based on a randomly generated hash of their unique identifier (for example, hashing user_id with a random seed). This hash-based method is stable over time, so a user who cancels once under one fee variant will remain in that same group throughout the experiment. It is important to confirm that:
The random seed or hashing mechanism does not correlate with user attributes like signup time or geographic location.
There are no points in the code or data pipeline where group assignment might accidentally be overridden, changed, or filtered out.
Edge Cases:
If certain users reinstall or create multiple accounts, they might end up in different arms of the experiment. This can slightly distort results if such behavior is widespread.
If your system changes the assignment logic for newly registered users mid-experiment, you could unintentionally skew the distribution of user segments across fee variants.
Verifying the randomization can be done by checking the distribution of key user features (e.g., region, ride frequency, historical spend) across groups to ensure none of the groups look statistically different on these initial traits.
How might a surge-based or time-dependent cancellation fee impact the experiment?
Instead of having a fixed fee, one might consider a dynamic cancellation fee that increases or decreases during peak hours or busy regions. While this approach can be lucrative, it complicates the experiment:
Measuring the effect: A time-based or location-based fee introduces more variables. You must analyze the interaction between time of day, region, and the assigned fee structure to disentangle the cause of any changes in user behavior.
Data partitioning: The experimental design must account for different usage patterns across regions (urban vs. suburban) and times (rush hour vs. off-peak). Random assignment alone might not be enough because user distribution in these periods can differ.
User perception: Dynamic pricing is sometimes controversial if users feel the fee is unpredictable. This can lead to negative sentiment or strategic behavior (e.g., users waiting until surge is over to cancel).
Edge Cases:
Rare but high-impact events (like a major concert causing sudden surges) can skew data if such surges only affect one segment predominantly.
Users who regularly schedule rides might notice that fees vary across days, causing confusion or dissatisfaction.
Careful logging of user behaviors with time and location stamps is crucial to controlling for these effects. A well-structured experiment might need separate A/B/C test partitions for both peak and off-peak times, increasing sample size requirements substantially.
Could a multi-armed bandit algorithm be better than a simple A/B/C test for choosing the fee?
Classic A/B/C testing equally distributes users among fee variants for a fixed duration, then picks the winner. A multi-armed bandit approach adaptively allocates more users to the currently best-performing option while still exploring the others. This can speed up convergence to an optimal fee.
One popular choice for multi-armed bandit is the Upper Confidence Bound (UCB) algorithm, represented by a formula for the confidence bound. A simplified version of the bound for arm a at time t can be expressed as:

Where:
UCB_t(a) is the upper confidence bound for arm a at time t.
hat(mu)_a is the empirical mean reward (for instance, net revenue per user) from arm a thus far.
c is a tunable constant controlling the exploration-exploitation balance.
t is the current round or total number of interactions overall.
N_a is how many times arm a has been played (how many users or rides assigned to that fee variant).
Advantages:
Faster learning of which fee is more optimal; more users see better options sooner.
Continual reallocation as user behavior shifts over time.
Pitfalls:
Implementation complexity is higher.
The definition of the “reward” function must be carefully chosen (e.g., net revenue, user satisfaction, or a composite metric).
If user response to a higher fee is delayed (like increased churn manifesting slowly), the bandit might prematurely converge on a suboptimal fee.
Moreover, multi-armed bandits require robust monitoring to detect if new external factors suddenly shift user preferences, in which case the algorithm may need to reset or adapt to changing conditions.
How to handle users who repeatedly cancel within a short time frame?
Some users might create “extreme” data patterns by booking and canceling repeatedly. These edge cases can inflate cancellation counts or total fees in ways that do not reflect typical behavior.
Potential Mitigation:
Implement a rule limiting how many cancellations within a short window can be tested for the same user. Excessive cancellations might indicate fraudulent or malicious activity.
Exclude outliers if their cancellation behavior is 10+ standard deviations above the mean, but only do this if you are certain it is not a valid user segment.
Edge Cases:
A traveler booking multiple times due to legitimate ride coordination issues may appear abnormal but not fraudulent.
Removing these data points might skew the results if a non-trivial fraction of your user base genuinely cancels multiple times.
A balanced approach is to keep a separate log of abnormally high-canceling users, investigating them carefully rather than discarding them outright. This ensures you maintain a realistic picture of your user landscape.
How to account for driver cancellations or driver behavior in setting passenger cancellation fees?
Focusing solely on passenger cancellations can neglect the fact that drivers may also cancel for various reasons (traffic, personal emergencies, acceptance of better fares, etc.). If drivers frequently cancel or are slow to arrive, passengers might be more justified in canceling. Hence, ignoring driver behavior can lead to suboptimal fee decisions.
Ways to address this:
Track both passenger and driver cancellation rates together.
Segment by reason for cancellation and measure how often it’s due to poor driver availability or acceptance.
If a high fraction of cancellations in the $5 fee group results from driver tardiness, the passenger may perceive the fee as unfair.
Edge Cases:
Regions with driver shortages can inflate passenger-initiated cancellations due to long wait times. Charging higher fees in these areas could deepen user dissatisfaction.
In some markets, drivers might attempt to force passenger cancellations by not moving, so the passenger pays a cancellation fee.
Including driver metrics in the experimental design can uncover these pitfalls. Sometimes, having a dynamic refund policy if the driver is far away can reduce negative outcomes on the passenger side.
How do you monitor the experiment for potential negative user sentiment or viral backlash on social media?
When changing fees, there is a risk of negative user sentiment spreading quickly, especially if higher fees are deemed exploitative. Monitoring user feedback channels is crucial during the test.
Monitoring Mechanisms:
Track an “uninstall rate” or “negative app rating” spike, possibly tying it to the user’s assigned fee group.
Scrape social media or app store reviews for keywords indicating frustration about higher cancellation fees.
Provide an in-app feedback prompt asking passengers about their satisfaction post-cancellation.
Edge Cases:
A small but influential group of early adopters might publicly complain, influencing other users’ perceptions.
A high fee variant might yield good revenue data in the short term but spawn long-term brand damage if not checked.
To protect brand reputation, some companies set automated guardrails that pause or scale back the test if negative indicators exceed a predefined threshold (e.g., if the net promoter score drops significantly or the rate of negative mentions on Twitter surges).
What about analyzing the long-term user retention after the experiment concludes?
A short-term experiment might reveal that $5 fees maximize revenue, but some users could switch to competitors in the following months. To fully validate the results, you often need a post-experiment monitoring phase. During this phase, you track key metrics for users who experienced each fee, even after you unify everyone under the chosen new policy.
Possible Approaches:
Hold a subset of users in a control group that remains under their old fee structure for several additional weeks to see if retention metrics diverge compared to those shifted to the new fee.
Assess ride frequency, user churn, re-engagement with promotions, and overall user lifetime value.
Edge Cases:
Seasonality might mask churn effects if the post-experiment window coincides with holidays or a time of typically high/low usage.
Competitors might introduce promotions that overshadow the effect of the new fee on retention, complicating the analysis.
Without looking at medium- to long-term data, you risk an overly simplistic conclusion that the higher fee is optimal for immediate revenue without appreciating the cost of future user loss.
How to incorporate external economic factors or macro trends when evaluating experiment results?
External forces, such as fluctuations in fuel prices, inflation rates, or shifts in general consumer spending, can affect how sensitive users are to cancellation fees. If the experiment runs through a period of economic volatility, user behaviors might not reflect normal conditions.
Practical Measures:
Record economic indicators over the experiment’s time frame.
Conduct a regression analysis where external economic signals (e.g., monthly inflation data) serve as covariates.
Segment time periods based on major economic events (like a sudden rise in gas prices) to see if the fee’s effect changes significantly before and after.
Edge Cases:
In times of recession, even a $1 fee could feel too high for budget-conscious riders.
A sudden spike in competitor pricing might mask negative effects of your own fee increase, giving a misleading sense of user tolerance.
Recognizing these macro factors in your evaluation helps distinguish real user responses to the cancellation fee from shifts driven by the overall market environment. If you do not account for these factors, you might incorrectly infer cause-and-effect in your experiment conclusions.