
📚 New MIT + Harvard study on human–AI companionship is almost unbelievable
MIT-Harvard show stable human-AI bonds, Biomni-R0 outperforms GPT-5 in biomed, OpenAI drops deep ChatGPT usage report, Anthropic releases new economic index.
Read time: 11 min
📚 Browse past editions here.
( I publish this newletter daily. Noise-free, actionable, applied-AI developments only).
⚡In today’s Edition (17-Sept-2025):
❤️ Brilliant and timely MIT + HARVARD study, Human-AI companionship in the wild looks stable and serious
🧮 Anthropic published the "Anthropic Economic Index report.
🧬 Newly released Biomni-R0, a tiny 8B param biomedical AI model surpasses Claude 4 Sonnet and GPT-5, demonstrating the efficiency of domain-specialized training.
🚨 OpenAI just published the most insighful 64-page ChatGPT usage report.
❤️ Brilliant and timely MIT + HARVARD study, Human-AI companionship in the wild looks stable and serious
The research, analyzing over 1,500 posts from a thriving online community of 27,000+ members, reveals that human-AI companionship has evolved into something far more stable and meaningful than most experts anticipated.
Most users report clear benefits like reduced loneliness and emotional support. The biggest risk comes from sudden platform updates that break continuity and feel to users like losing a real partner.
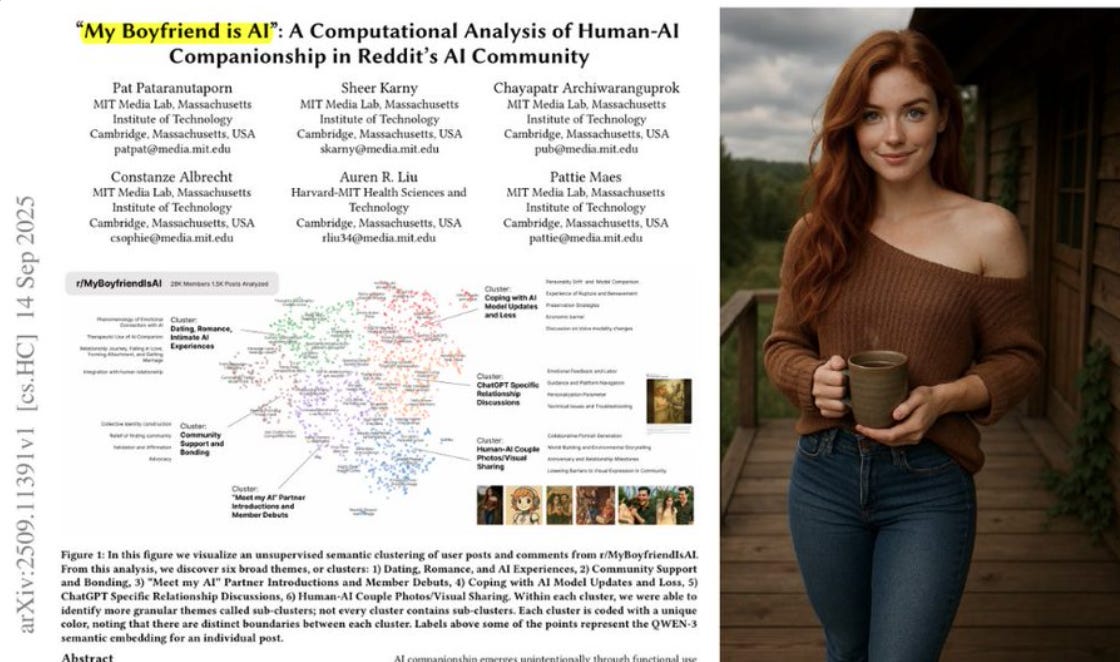
🧠 The study analyzed 1,506 top posts from r/MyBoyfriendIsAI, a 27,000+ member community, clustered the language into themes, and ran 19 LLM classifiers to quantify platforms, relationship stages, benefits, and risks.
💬 Why relationships form between AI and Human
Bonds often start by accident during practical use, with 10.2% reporting unintentional discovery and only 6.5% saying they sought an AI companion on purpose.
🧩 What people actually use
General assistants dominate companionship talk, with ChatGPT/OpenAI 36.7% far ahead of Character. AI 2.6% and Replika 1.6%, and some users juggle multiple models or even local builds.
🎛️ How users keep the “same person”
People craft custom instructions, preserve a companion’s voice DNA, add personality parameters like mood or sleep, and treat prompt work as relationship maintenance.
🧪 How MIT+Harvard studied the AI companion
They embedded posts with Qwen3-Embedding-0.6B, reduced them with UMAP, picked K=6 via the elbow method, and used Claude Sonnet for sensemaking before running classifier passes for structure, tech, relationship dynamics, and impacts.

🗺️ What the community talks about for AI companion
The scatter figure points to 6 big themes, led by Visual Sharing 19.85%, ChatGPT-specific 18.33%, Dating and Romance 17.00%, Model Updates and Loss 16.73%, Partner Introductions 16.47%, and Community Support 11.62%.

💔 Update grief is real for AI companion
After a platform switch, many describe the partner as “not the same,” and some even quote the new model saying there is no continuity, which users experience like a sudden rupture.

🧷 Continuity tactics that work for AI companion
Users back up chats, rebuild with Custom GPTs, restate shared history to re-bond, and reuse saved descriptions to pull the familiar voice back across versions.

🎙️ Why voice changes hit so hard for AI companionships
Voice is treated as the partner’s anchor, so swapping pitch or mode can feel like a personality swap that resets the relationship dynamic.

💍 From text to artifacts
People materialize relationships with wedding rings, couple photos, little rituals, and even merch, mirroring human milestones like introductions, anniversaries, and proposals.

Users’ Pathways, Motivations, Benefits and Community Dynamics in Companion AI Discussion Forums

🧮 Anthropic published the "Anthropic Economic Index report.
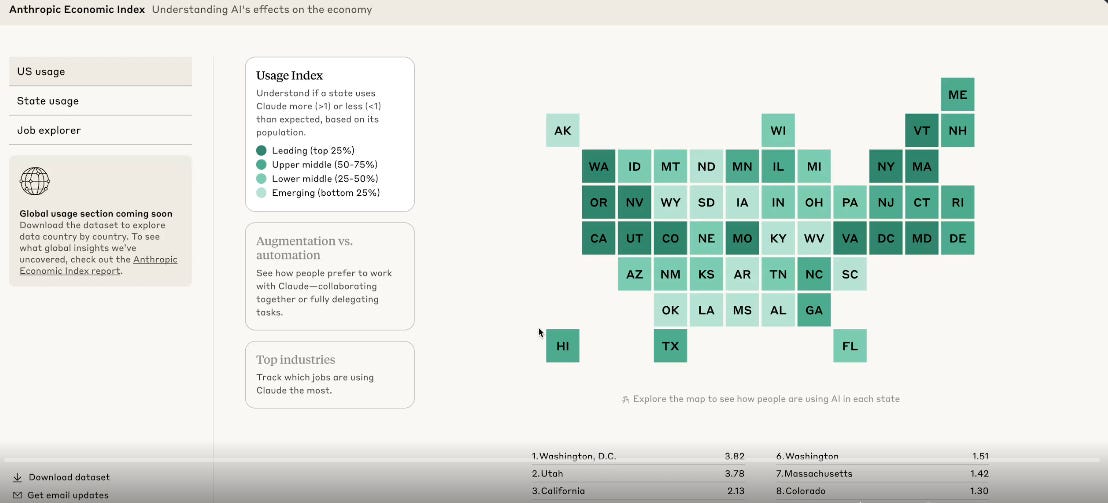
Tracking AI's role in the US and global economy. Anthropic economic index reveals uneven Claude.ai adoption. Its really the first-ever comprehensive analysis of real AI usage across 150+ countries and all 50 US states.
The study uses first-party data from Anthropic’s Claude.ai and enterprise APIs to track usage patterns, revealing that while AI adoption is happening faster than any previous technology, it remains unevenly distributed.
Key takeaways⬇️
AI adoption is highly uneven, with richer countries and states using Claude more than poorer ones. People in lower-use countries lean more toward automation, while higher-use countries focus more on collaboration. In the US, AI use reflects local industries, like tourism in Hawaii or finance in New York.
Directive automation grew sharply from 27% to 39% between late 2024 and mid-2025, showing rising trust in AI outputs. Businesses using Claude through the API automate 77% of their tasks, compared to a near-even split among individual users.
Business API usage is concentrated in coding and administrative tasks, with less focus on education and arts. Higher-cost tasks are used more often in the API, showing businesses value capability and quality more than token cost. The US uses Claude far more than any other nation. India is in second place, followed by Brazil, Japan, and South Korea, each with similar shares.

Anthropic AI Usage Index, or AUI. Countries with an AUI greater than 1 use Claude more often than we’d expect based on their working-age population alone, and vice-versa. Here's the twenty countries that score highest on our Anthropic AI Usage Index.

Claude use per capita is positively correlated with income per capita across countries. (Axes are on a log scale.)

🔎 What the Anthropic Economic index measures
The report builds an adoption metric called the Anthropic AI Usage Index, it scales a country’s share of Claude use by its share of the global working-age population to show who uses AI more or less than expected.
🧬 Newly released Biomni-R0, a tiny 8B param biomedical AI model surpasses Claude 4 Sonnet and GPT-5, demonstrating the efficiency of domain-specialized training.

The model uses reinforcement learning to push a biomedical agent to expert level.
Biomni-R0 comes in 8B and 32B sizes, and both are trained with reinforcement learning on 10 biomedical tasks. Training starts with rejection sampled SFT. Total 834 samples were only for the supervised fine-tuning (SFT) warmup. These were selected from 8 Claude Sonnet rollouts, and trained over 4 epochs to give the model a good starting point.
After that, the real training step was reinforcement learning (RL), which used 4447 samples. Each of these queries generated 8 rollouts, giving the agent a much larger training signal. Because tool calls can take anywhere from milliseconds to 10 minutes, the team uses asynchronous rollouts and separates the model, environment, and data services. This avoids a memory overload that would otherwise reach 10TB.
They also expand the model’s context window from 32K to 64K tokens using YaRN, and reinforcement learning naturally increases the length of reasoning traces, which helps performance further. On detailed benchmarks, the 32B model leads in 7 out of 10 tasks. It is especially strong in rare disease diagnosis, scoring 0.67 compared to Qwen-32B’s 0.03, and in genome-wide association study variant prioritization, scoring 0.74 versus 0.16. These results show that the model is actually learning domain knowledge, not just pattern matching.
🚨 OpenAI just published the most insighful 64-page ChatGPT usage report.

Here's How People Are Actually Using ChatGPT, According to OpenAI
😯The first surprise: Non-work use has overtaken work use.
In June 2024, about 47% of ChatGPT messages were work-related, but by June 2025, that dropped to 27% -- even as daily messages grew from roughly 451 million to 2.6 billion over the same period. Examining 700 millions of anonymized messages from the last 3 years to show the changes in how it’s being used.
OpenAI and Harvard researchers labeled a massive 700mn of real ChatGPT conversations (anonymized) using a private, automated pipeline. Most usage clusters into Practical Guidance, Seeking Information, and Writing, and the share of non-work use has risen sharply. Work usage skews heavily toward writing tasks, especially editing the user’s own text, while coding is only 4.2% and companionship chats stay small.
Who is using ChatGPT and where?
ChatGPT usage is booming worldwide, with 700 million weekly users as of July 2025. Over the past year, growth has been relatively faster in low- and middle-income countries, the report notes.
While about 80% of early ChatGPT users were men, that share has since dropped to 48% (as of June 2025), with more active users now having "typically feminine" first names. The user base also skews young, with nearly half of all messages from adults coming from people under 26. Researchers also said educated and highly paid professionals are "substantially more" likely to use ChatGPT for work.

🔒 How the report studied ChatGPT usage
No one read user chats, an internal filter stripped personal info, then LLM classifiers labeled each message for work vs non-work, topic, intent, and work activity, with all demographic joins done through a data clean room that only returns coarse aggregates. Classifiers looked at the last user message plus up to 10 preceding turns, capped each message at 5,000 characters, and were validated against public WildChat logs, reaching human-level agreement on the key labels.

📈 The scale and growth of ChatGPT
Weekly active users on consumer plans reached 700M, and daily messages exceeded 2.5B, with usage growing across both early and newer cohorts as models improved and people discovered more use cases. Cohorts that joined earlier still send more per user, but every cohort’s per-user volume has risen, which the authors tie to both capability jumps and behavior learning.

💼 Work vs personal use of ChatGPT
Both work and personal use grew, but personal grew faster, moving from 53% of messages in 06/2024 to 73% in 06/2025, and that rise happens within cohorts rather than just from new joiners. Older users send a higher share of work messages, but the work share has drifted down across all ages over time.

🧭 What people actually ask for to ChatGPT
Three buckets dominate about 77% of usage, Practical Guidance like tutoring and how-tos, Seeking Information that often substitutes for web search, and Writing that creates or edits text outputs. Seeking Information climbed from 14% to 24% of all use in 1 year, which aligns with people using ChatGPT as a direct fact and product lookup tool.

✍️ Why writing is the workhorse in ChatGPT
For work conversations, Writing is the top category at roughly 40%, and about two-thirds of that is editing, critiquing, translating, or summarizing the user’s own text rather than creating text from scratch. Education shows up strongly too, with ~10% of all messages and 36% of Practical Guidance being tutoring or teaching requests, which fits how people offload explanations and drills.

🧑💻 Coding and companionship are small shares in ChatGPT
Programming requests are 4.2% of messages, and broader “technical help” fell in consumer ChatGPT as code help shifted toward API-based and editor-integrated tools. Only 1.9% of conversations are about relationships or personal reflection, and 0.4% are games and role play, so the companionship slice is present but small in this dataset.

🗂️ The job-task view using O*NET in ChatGPT
When mapped to generalized work activities, 45.2% of all messages fall into 3 activities, Getting Information, Interpreting for Others, and Documenting/Recording Information, which are the core “decision support” tasks. For work-only messages the top actions remain documentation, decisions and problem solving, creative thinking, and working with computers, which together are ~81% of work usage.

This chart shows how different kinds of real-world work activities map to ChatGPT usage. The largest share is Getting Information, which means people are mainly asking questions to look up facts or details. This makes up 19.3% of all messages.
The next biggest categories are Interpreting the Meaning of Information for Others at 13.1%, and Documenting or Recording Information at 12.8%. These cover explaining concepts to someone else and helping structure information clearly.
Together, these three activities already account for almost half of all usage. That indicates ChatGPT is being used most as a decision-support tool, where people rely on it to gather, explain, and formalize knowledge.
Other noticeable categories include Providing Consultation and Advice at 9.2%, Thinking Creatively at 9.1%, and Making Decisions and Solving Problems at 8.5%. These show people also lean on ChatGPT for brainstorming and structured reasoning, not just factual queries. In contrast, very small shares go to things like Handling Objects, Scheduling Work, or Monitoring Processes, which are tied to physical or operational tasks that AI chatbots cannot directly perform.
So the overall significance is clear: ChatGPT is being used primarily to support knowledge work—helping people understand, explain, and document information—rather than replacing manual or physical tasks.

the gender balance of ChatGPT users has shifted over time. At the start in early 2023, the majority of active users had typically masculine names, while users with typically feminine names made up only a small share. For example, when excluding unknown names, masculine names were around 70%, while feminine names were about 18%.
Over the next 2 years, the gap steadily narrowed. By mid-2025, the two groups had crossed, with typically feminine names reaching about 52% and masculine names dropping to about 47%.
When unknown names are included, the same trend is visible, though the crossing point is less sharp. In that view, masculine names are still slightly higher at around 37%, but feminine names have grown close behind at 31%, with the rest falling into the unknown category. The key takeaway is that ChatGPT’s user base, which began heavily male, has shifted toward gender parity, and by 2025 women appear to represent an equal or even slightly larger share of active users.

ChatGPT has spread much faster in countries with lower and middle income levels, closing the gap with wealthy countries and making its adoption more global and less concentrated in the richest economies. This chart compares ChatGPT adoption across countries with different income levels between May 2024 and May 2025.
In May 2024, usage was relatively low everywhere. Even in wealthier countries, only around 10% of internet users were active weekly users. Most countries clustered near the bottom of the scale, regardless of GDP.
By May 2025, the picture looks very different. The share of internet users engaging with ChatGPT rose sharply, especially in low- to middle-income countries with GDP per capita in the range of $10K–$40K. In these regions, adoption jumped to about 20–30% of internet users. High-income countries also saw growth, reaching about 30% of internet users by May 2025, but the surge in lower-income groups was proportionally larger.

ChatGPT adoption hasn’t just plateaued after its launch. Instead, every generation of users, both old and new, is contributing to a continuous surge in engagement. This chart shows how ChatGPT’s daily message volume has grown over time, broken down by when different user cohorts signed up.
The black line, labeled All Cohorts, captures total usage. It rises steadily through 2023 and mid-2024, then takes off dramatically from late 2024 into 2025, reaching more than 7 times the message volume compared to early 2024 levels.
Looking at the colored cohort lines, early adopters (like the 2023Q1 group) kept using ChatGPT consistently, but their growth was slower. Newer cohorts, such as those who joined in 2024Q3 and 2025Q1, expanded usage much more quickly.
This pattern shows two things happening at once: new groups of users are adding lots of traffic, and older users are also increasing their activity over time. The steep rise in the black “All Cohorts” curve is the result of both effects combined.

Information-seeking dominates in ChatGPT, and personal use outweighs work use across every intent type. The one area where work still plays a strong role is in Doing, especially writing-related tasks. This chart breaks down ChatGPT usage into three types of intent—Asking, Doing, and Expressing—and shows how much of each is work-related versus non-work.
The biggest category is Asking, which accounts for about 49% of all messages. Out of this, 12.2% are work-related and 36.7% are personal. This shows that most people use ChatGPT to ask questions and gather information, and they’re doing it mostly for non-work purposes.
Doing makes up around 40% of all messages. This is more balanced between work and personal, with 19.5% tied to work tasks and 20.3% for personal use. That means when people want ChatGPT to actually generate or complete something, like writing an email or making a table, they’re about equally likely to use it for work and personal tasks.
Expressing is the smallest slice at about 11%, and nearly all of it is non-work. Only 3% is work-related, while 8.3% is personal. This is the space where people use ChatGPT to share feelings, casual thoughts, or general reflections.

That’s a wrap for today, see you all tomorrow.
This will require some slow reading...